Humana 2011 Annual Report Download - page 58
Download and view the complete annual report
Please find page 58 of the 2011 Humana annual report below. You can navigate through the pages in the report by either clicking on the pages listed below, or by using the keyword search tool below to find specific information within the annual report.-
 1
1 -
2
-
3
-
4
-
5
-
6
-
7
-
8
-
9
-
10
-
11
-
12
-
13
-
14
-
15
-
16
-
17
-
18
-
19
-
20
-
21
-
22
-
23
-
24
-
25
-
26
-
27
-
28
-
29
-
30
-
31
-
32
-
33
-
34
-
35
-
36
-
37
-
38
-
39
-
40
-
41
-
42
-
43
-
44
-
45
-
46
-
47
-
 48
48 -
 49
49 -
 50
50 -
 51
51 -
 52
52 -
 53
53 -
 54
54 -
 55
55 -
 56
56 -
 57
57 -
 58
58 -
 59
59 -
 60
60 -
 61
61 -
 62
62 -
 63
63 -
 64
64 -
 65
65 -
 66
66 -
 67
67 -
 68
68 -
69
-
70
-
71
-
72
-
73
-
74
-
75
-
76
-
77
-
78
-
79
-
80
-
81
-
82
-
83
-
84
-
85
-
86
-
87
-
88
-
89
-
90
-
91
-
92
-
93
-
94
-
95
-
96
-
97
-
98
-
99
-
100
-
101
-
102
-
103
-
104
-
105
-
106
-
107
-
108
-
109
-
110
-
111
-
112
-
113
-
114
-
115
-
116
-
117
-
118
-
119
-
120
-
121
-
122
-
123
-
124
-
125
-
126
-
127
-
128
-
129
-
130
-
131
-
132
-
133
-
134
-
135
-
136
-
137
-
138
-
139
-
140
-
141
-
142
-
143
-
144
-
145
-
146
-
147
-
148
-
149
-
150
-
151
-
152
-
153
-
154
-
155
-
156
-
157
-
158
-
159
-
160
 |
 |
prior-period medical claims reserve development of approximately $0.77 per diluted common share for 2011
compared to $0.86 per diluted common share for 2010. Net income for the 2010 period also included the
negative impact of a $147 million ($0.55 per diluted common share) write-down of deferred acquisition costs
associated with our individual commercial medical policies in our Retail Segment, and a net charge of $139
million ($0.52 per diluted common share) for reserve strengthening associated with our closed block of long-term
care policies in our Other Businesses as discussed in Note 17 to the consolidated financial statements included in
Item 8. – Financial Statements and Supplementary Data.
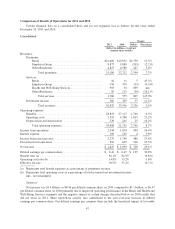
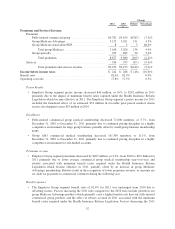
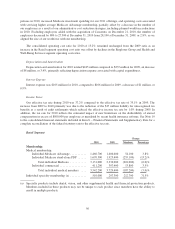
Premiums Revenue
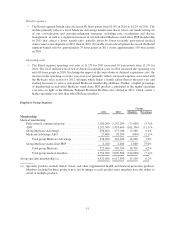
Consolidated premiums increased $2.4 billion, or 7.3%, from 2010 to $35.1 billion for 2011, primarily due
to an increase in Retail segment premiums, partially offset by a decline in Employer Group segment premiums.
The increase in Retail segment premiums primarily resulted from higher average individual Medicare Advantage
membership. The decrease in Employer Group segment premiums primarily resulted from lower average fully-
insured commercial group medical membership. Average membership is calculated by summing the ending
membership for each month in a period and dividing the result by the number of months in a period. Premiums
revenue reflects changes in membership and increases in average per member premiums. Items impacting
average per member premiums include changes in premium rates as well as changes in the geographic mix of
membership, the mix of product offerings, and the mix of benefit plans selected by our membership.
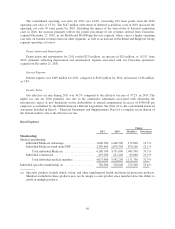
Services Revenue
Consolidated services revenue increased $805 million, or 145.0%, from 2010 to $1.4 billion for 2011,
primarily due to an increase in primary care services revenue in our Health and Well-Being Services segment,
primarily as a result of the acquisition of Concentra on December 21, 2010.
Investment Income
Investment income totaled $366 million for 2011, an increase of $37 million from 2010, primarily reflecting
higher interest rates as well as higher average invested balances as a result of the reinvestment of operating cash
flows.
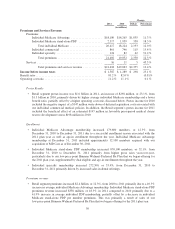
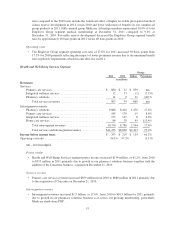
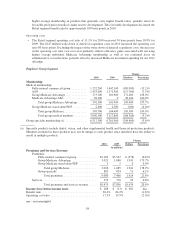
Benefit Expenses
Consolidated benefit expenses were $28.8 billion for 2011, an increase of $1.7 billion, or 6.3%, from 2010.
The increases were primarily due to a $1.8 billion, or 11.3%, year-over-year increase in Retail segment benefit
expenses in 2011, primarily driven by an increase in the average number of Medicare members, partially offset
by a decline in Employer Group segment benefit expenses.
The consolidated benefit ratio for 2011 was 82.1%, declining 80 basis points from the 2010 benefit ratio of
82.9%, primarily driven by a decline in the Retail segment benefit ratio and a net charge for reserve
strengthening associated with our closed block of long-term care policies in our Other Businesses in 2010 that
did not recur in 2011.
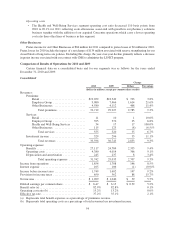
Operating Costs
Our segments incur both direct and shared indirect operating costs. We allocate the indirect costs shared by
the segments primarily as a function of revenues. As a result, the profitability of each segment is interdependent.
Consolidated operating costs increased $1.0 billion, or 23.2%, during 2011 compared to 2010, primarily due
an increase in operating costs in our Health and Well-Being Segment as a result of the acquisition of Concentra
on December 21, 2010, as well as an increase in operating costs in our Retail segment as a result of increased
expenses associated with servicing higher average Medicare Advantage membership. Operating costs for 2010
include $147 million for the write-down of deferred acquisition costs associated with our individual commercial
medical policies in our Retail Segment.
48