Humana 2011 Annual Report Download - page 113
Download and view the complete annual report
Please find page 113 of the 2011 Humana annual report below. You can navigate through the pages in the report by either clicking on the pages listed below, or by using the keyword search tool below to find specific information within the annual report.-
 1
1 -
2
-
3
-
4
-
5
-
6
-
7
-
8
-
9
-
10
-
11
-
12
-
13
-
14
-
15
-
16
-
17
-
18
-
19
-
20
-
21
-
22
-
23
-
24
-
25
-
26
-
27
-
28
-
29
-
30
-
31
-
32
-
33
-
34
-
35
-
36
-
37
-
38
-
39
-
40
-
41
-
42
-
43
-
44
-
45
-
46
-
47
-
48
-
49
-
50
-
51
-
52
-
53
-
54
-
55
-
56
-
57
-
58
-
59
-
60
-
61
-
62
-
63
-
64
-
65
-
66
-
67
-
68
-
69
-
70
-
71
-
72
-
73
-
74
-
75
-
76
-
77
-
78
-
79
-
80
-
81
-
82
-
83
-
84
-
85
-
86
-
87
-
88
-
89
-
90
-
91
-
92
-
93
-
94
-
95
-
96
-
97
-
98
-
99
-
100
-
101
-
102
-
 103
103 -
 104
104 -
 105
105 -
 106
106 -
 107
107 -
 108
108 -
 109
109 -
 110
110 -
 111
111 -
 112
112 -
 113
113 -
 114
114 -
 115
115 -
 116
116 -
 117
117 -
 118
118 -
 119
119 -
 120
120 -
 121
121 -
 122
122 -
 123
123 -
124
-
125
-
126
-
127
-
128
-
129
-
130
-
131
-
132
-
133
-
134
-
135
-
136
-
137
-
138
-
139
-
140
-
141
-
142
-
143
-
144
-
145
-
146
-
147
-
148
-
149
-
150
-
151
-
152
-
153
-
154
-
155
-
156
-
157
-
158
-
159
-
160
 |
 |

Humana Inc.
NOTES TO CONSOLIDATED FINANCIAL STATEMENTS—(Continued)
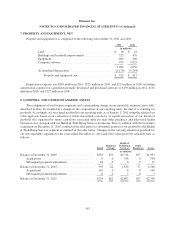
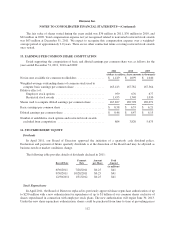
7. PROPERTY AND EQUIPMENT, NET
Property and equipment was comprised of the following at December 31, 2011 and 2010:
2011 2010
(in millions)
Land ............................................ $ 18 $ 18
Buildings and leasehold improvements ................. 523 476
Equipment ........................................ 606 540
Computer software ................................. 935 1,025
2,082 2,059
Accumulated depreciation ........................... (1,170) (1,244)
Property and equipment, net ...................... $ 912 $ 815
Depreciation expense was $249 million in 2011, $225 million in 2010, and $213 million in 2009, including
amortization expense for capitalized internally developed and purchased software of $139 million in 2011, $136
million in 2010, and $127 million in 2009.
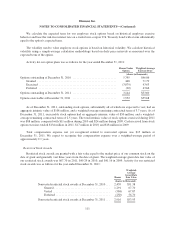
8. GOODWILL AND OTHER INTANGIBLE ASSETS
The realignment of our business segments and corresponding change in our reportable segments, more fully
described in Note 16, resulted in a change in the composition of our reporting units, the unit of accounting for
goodwill. Accordingly, we reassigned goodwill to our reporting units as of January 1, 2011 using the relative fair
value approach based on an evaluation of future discounted cash flows. A significant portion of our historical
goodwill was supported by future cash flows associated with our mail-order pharmacy and behavioral health
businesses now grouped with our Health & Well-Being Services businesses. This, in addition with the Concentra
acquisition on December 21, 2010, resulted in the allocation of a substantial portion of our goodwill to the Health
& Well-Being Services segment as outlined in the table below. Changes in the carrying amount of goodwill for
our new reportable segments for the years ended December 31, 2011 and 2010 (retrospectively adjusted) were as
follows:
Retail
Employer
Group
Health &
Well-Being
Services
Other
Businesses Total
(in millions)
Balance at December 31, 2009 ......................... $565 $53 $1,318 $57 $1,993
Acquisitions ................................... 0 0 538 0 538
Subsequent payments/adjustments .................. 28 9 0 0 37
Balance at December 31, 2010 ......................... 593 62 1,856 57 2,568
Acquisitions ................................... 161 0 8 0 169
Subsequent payments/adjustments .................. 0 0 3 0 3
Balance at December 31, 2011 ......................... $754 $62 $1,867 $57 $2,740
103