Humana 2011 Annual Report Download - page 82
Download and view the complete annual report
Please find page 82 of the 2011 Humana annual report below. You can navigate through the pages in the report by either clicking on the pages listed below, or by using the keyword search tool below to find specific information within the annual report.-
 1
1 -
2
-
3
-
4
-
5
-
6
-
7
-
8
-
9
-
10
-
11
-
12
-
13
-
14
-
15
-
16
-
17
-
18
-
19
-
20
-
21
-
22
-
23
-
24
-
25
-
26
-
27
-
28
-
29
-
30
-
31
-
32
-
33
-
34
-
35
-
36
-
37
-
38
-
39
-
40
-
41
-
42
-
43
-
44
-
45
-
46
-
47
-
48
-
49
-
50
-
51
-
52
-
53
-
54
-
55
-
56
-
57
-
58
-
59
-
60
-
61
-
62
-
63
-
64
-
65
-
66
-
67
-
68
-
69
-
70
-
71
-
 72
72 -
 73
73 -
 74
74 -
 75
75 -
 76
76 -
 77
77 -
 78
78 -
 79
79 -
 80
80 -
 81
81 -
 82
82 -
 83
83 -
 84
84 -
 85
85 -
 86
86 -
 87
87 -
 88
88 -
 89
89 -
 90
90 -
 91
91 -
 92
92 -
93
-
94
-
95
-
96
-
97
-
98
-
99
-
100
-
101
-
102
-
103
-
104
-
105
-
106
-
107
-
108
-
109
-
110
-
111
-
112
-
113
-
114
-
115
-
116
-
117
-
118
-
119
-
120
-
121
-
122
-
123
-
124
-
125
-
126
-
127
-
128
-
129
-
130
-
131
-
132
-
133
-
134
-
135
-
136
-
137
-
138
-
139
-
140
-
141
-
142
-
143
-
144
-
145
-
146
-
147
-
148
-
149
-
150
-
151
-
152
-
153
-
154
-
155
-
156
-
157
-
158
-
159
-
160
 |
 |

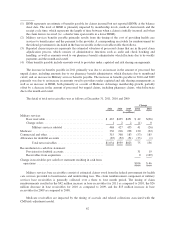
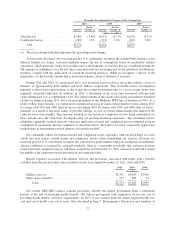
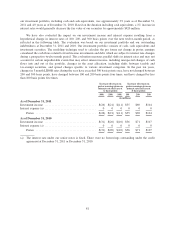
Favorable Development by Changes in Key Assumptions
2011 2010 2009
Amount
Factor
Change (a) Amount
Factor
Change (a) Amount
Factor
Change (a)
(dollars in millions)
Trend factors ....................... $(189) (3.8)% $(213) (4.7)% $(151) (3.5)%
Completion factors .................. (183) 1.2% (221) 1.6% (102) 0.8%
Total ......................... $(372) $(434) $(253)
(a) The factor change indicated represents the percentage point change.
As previously discussed, our reserving practice is to consistently recognize the actuarial best estimate of our
ultimate liability for claims. Actuarial standards require the use of assumptions based on moderately adverse
experience, which generally results in favorable reserve development, or reserves that are considered redundant.
The amount of redundancy over the last three years primarily has been impacted by the growth in our Medicare
products, coupled with the application of consistent reserving practices. When we recognize a release of the
redundancy, we disclose the amount that is not in the ordinary course of business, if material.
During 2011 and 2010, we experienced prior year favorable reserve releases not in the ordinary course of
business of approximately $205 million and $231 million, respectively. This favorable reserve development
primarily resulted from improvements in the claims processing environment and, to a lesser extent, better than
originally estimated utilization. In addition, in 2010, a shortening of the cycle time associated with provider
claim submissions was a contributing factor. The improvements in the claims processing environment benefited
all lines of business during 2011, but were most prominent in our Medicare PFFS line of business in 2010. As a
result of these improvements, we experienced a significant increase in claim overpayment recoveries during 2011
for claims with 2010 and 2009 dates of service and during 2010 for claims with 2009 and 2008 dates of service,
primarily as a result of increased audits of provider billings, as well as system enhancements that improved the
claim recovery functionality. This increase resulted in our historical completion factors being understated for
those periods since they had been developed using our previous historical experience. The remaining reserve
redundancy primarily resulted from our consistent application of trend and completion factors estimated using an
assumption of moderately adverse conditions as described above. We believe we have consistently applied our
methodology in determining our best estimate for benefits payable.
We continually adjust our historical trend and completion factor experience with our knowledge of recent
events that may impact current trends and completion factors when establishing our reserves. Because our
reserving practice is to consistently recognize the actuarial best point estimate using an assumption of moderately
adverse conditions as required by actuarial standards, there is a reasonable possibility that variances between
actual trend and completion factors and those assumed in our December 31, 2011 estimates would fall towards
the middle of the ranges previously presented in our sensitivity table.
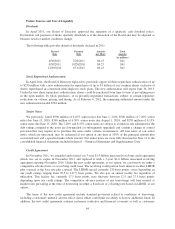
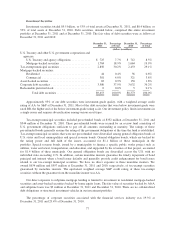
Benefit expenses associated with military services and provisions associated with future policy benefits
excluded from the previous table were as follows for the years ended December 31, 2011, 2010 and 2009:
2011 2010 2009
(in millions)
Military services ............................................ $3,247 $3,059 $3,020
Future policy benefits ........................................ 127 306 73
Total ................................................. $3,374 $3,365 $3,093
Our current TRICARE contract contains provisions whereby the federal government bears a substantial
portion of the risk of financing health benefits. The federal government both reimburses us for our cost of
providing health benefits and bears responsibility for 80% of any variance from the annual targeted health care
cost and actual health care cost as more fully described in Item 7. Management’s Discussion and Analysis of
72