Humana 2011 Annual Report Download - page 93
Download and view the complete annual report
Please find page 93 of the 2011 Humana annual report below. You can navigate through the pages in the report by either clicking on the pages listed below, or by using the keyword search tool below to find specific information within the annual report.-
 1
1 -
2
-
3
-
4
-
5
-
6
-
7
-
8
-
9
-
10
-
11
-
12
-
13
-
14
-
15
-
16
-
17
-
18
-
19
-
20
-
21
-
22
-
23
-
24
-
25
-
26
-
27
-
28
-
29
-
30
-
31
-
32
-
33
-
34
-
35
-
36
-
37
-
38
-
39
-
40
-
41
-
42
-
43
-
44
-
45
-
46
-
47
-
48
-
49
-
50
-
51
-
52
-
53
-
54
-
55
-
56
-
57
-
58
-
59
-
60
-
61
-
62
-
63
-
64
-
65
-
66
-
67
-
68
-
69
-
70
-
71
-
72
-
73
-
74
-
75
-
76
-
77
-
78
-
79
-
80
-
81
-
82
-
 83
83 -
 84
84 -
 85
85 -
 86
86 -
 87
87 -
 88
88 -
 89
89 -
 90
90 -
 91
91 -
 92
92 -
 93
93 -
 94
94 -
 95
95 -
 96
96 -
 97
97 -
 98
98 -
 99
99 -
 100
100 -
 101
101 -
 102
102 -
 103
103 -
104
-
105
-
106
-
107
-
108
-
109
-
110
-
111
-
112
-
113
-
114
-
115
-
116
-
117
-
118
-
119
-
120
-
121
-
122
-
123
-
124
-
125
-
126
-
127
-
128
-
129
-
130
-
131
-
132
-
133
-
134
-
135
-
136
-
137
-
138
-
139
-
140
-
141
-
142
-
143
-
144
-
145
-
146
-
147
-
148
-
149
-
150
-
151
-
152
-
153
-
154
-
155
-
156
-
157
-
158
-
159
-
160
 |
 |

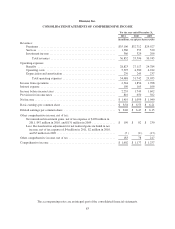
Humana Inc.
CONSOLIDATED STATEMENTS OF COMPREHENSIVE INCOME
For the year ended December 31,
2011 2010 2009
(in millions, except per share results)
Revenues:
Premiums .................................................... $35,106 $32,712 $29,927
Services ..................................................... 1,360 555 520
Investment income ............................................. 366 329 296
Total revenues ............................................ 36,832 33,596 30,743
Operating expenses:
Benefits ..................................................... 28,823 27,117 24,784
Operating costs ............................................... 5,395 4,380 4,014
Depreciation and amortization .................................... 270 245 237
Total operating expenses .................................... 34,488 31,742 29,035
Income from operations ............................................. 2,344 1,854 1,708
Interest expense ................................................... 109 105 106
Income before income taxes ......................................... 2,235 1,749 1,602
Provision for income taxes .......................................... 816 650 562
Net income ....................................................... $ 1,419 $ 1,099 $ 1,040
Basic earnings per common share ..................................... $ 8.58 $ 6.55 $ 6.21
Diluted earnings per common share ................................... $ 8.46 $ 6.47 $ 6.15
Other comprehensive income, net of tax:
Net unrealized investment gains, net of tax expense of $109 million in
2011, $47 million in 2010, and $131 million in 2009 ................ $ 190 $ 82 $ 230
Less: Reclassification adjustment for net realized gains included in net
income, net of tax expense of $4 million in 2011, $2 million in 2010,
and $7 million in 2009 ........................................ (7) (4) (13)
Other comprehensive income, net of tax ................................ 183 78 217
Comprehensive income ............................................. $ 1,602 $ 1,177 $ 1,257
The accompanying notes are an integral part of the consolidated financial statements.
83