Humana 2011 Annual Report Download - page 66
Download and view the complete annual report
Please find page 66 of the 2011 Humana annual report below. You can navigate through the pages in the report by either clicking on the pages listed below, or by using the keyword search tool below to find specific information within the annual report.-
 1
1 -
2
-
3
-
4
-
5
-
6
-
7
-
8
-
9
-
10
-
11
-
12
-
13
-
14
-
15
-
16
-
17
-
18
-
19
-
20
-
21
-
22
-
23
-
24
-
25
-
26
-
27
-
28
-
29
-
30
-
31
-
32
-
33
-
34
-
35
-
36
-
37
-
38
-
39
-
40
-
41
-
42
-
43
-
44
-
45
-
46
-
47
-
48
-
49
-
50
-
51
-
52
-
53
-
54
-
55
-
 56
56 -
 57
57 -
 58
58 -
 59
59 -
 60
60 -
 61
61 -
 62
62 -
 63
63 -
 64
64 -
 65
65 -
 66
66 -
 67
67 -
 68
68 -
 69
69 -
 70
70 -
 71
71 -
 72
72 -
 73
73 -
 74
74 -
 75
75 -
 76
76 -
77
-
78
-
79
-
80
-
81
-
82
-
83
-
84
-
85
-
86
-
87
-
88
-
89
-
90
-
91
-
92
-
93
-
94
-
95
-
96
-
97
-
98
-
99
-
100
-
101
-
102
-
103
-
104
-
105
-
106
-
107
-
108
-
109
-
110
-
111
-
112
-
113
-
114
-
115
-
116
-
117
-
118
-
119
-
120
-
121
-
122
-
123
-
124
-
125
-
126
-
127
-
128
-
129
-
130
-
131
-
132
-
133
-
134
-
135
-
136
-
137
-
138
-
139
-
140
-
141
-
142
-
143
-
144
-
145
-
146
-
147
-
148
-
149
-
150
-
151
-
152
-
153
-
154
-
155
-
156
-
157
-
158
-
159
-
160
 |
 |

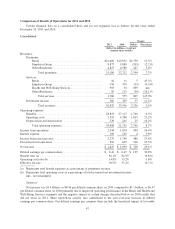
policies in 2010, increased Medicare investment spending for our 2011 offerings, and operating costs associated
with servicing higher average Medicare Advantage membership, partially offset by a decrease in the number of
our employees as a result of our administrative cost reduction strategies, including planned workforce reductions
in 2010. Excluding employees added with the acquisition of Concentra on December 21, 2010, the number of
employees decreased by 800 to 27,300 at December 31, 2010 from 28,100 at December 31, 2009, or 2.8%, as we
aligned the size of our workforce with our membership.
The consolidated operating cost ratio for 2010 of 13.2% remained unchanged from the 2009 ratio as an
increase in the Retail segment operating cost ratio was offset by declines in the Employer Group and Health and
Well-Being Services segment operating cost ratios.
Depreciation and Amortization
Depreciation and amortization for 2010 totaled $245 million compared to $237 million for 2009, an increase
of $8 million, or 3.4%, primarily reflecting depreciation expense associated with capital expenditures.
Interest Expense
Interest expense was $105 million for 2010, compared to $106 million for 2009, a decrease of $1 million, or
0.9%.
Income Taxes
Our effective tax rate during 2010 was 37.2% compared to the effective tax rate of 35.1% in 2009. The
increase from 2009 to 2010 primarily was due to the reduction of the $17 million liability for unrecognized tax
benefits as a result of audit settlements which reduced the effective income tax rate by 1.0% during 2009. In
addition, the tax rate for 2010 reflects the estimated impact of new limitations on the deductibility of annual
compensation in excess of $500,000 per employee as mandated by recent health insurance reforms. See Note 10
to the consolidated financial statements included in Item 8. – Financial Statements and Supplementary Data for a
complete reconciliation of the federal statutory rate to the effective tax rate.
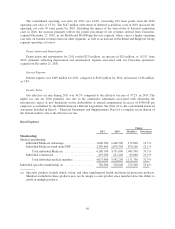
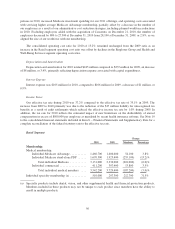
Retail Segment
Change
2010 2009 Members Percentage
Membership:
Medical membership:
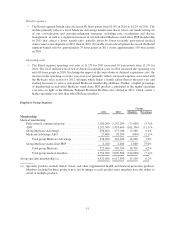
Individual Medicare Advantage ........... 1,460,700 1,406,600 54,100 3.8%
Individual Medicare stand-alone PDP ...... 1,670,300 1,925,400 (255,100) (13.2)%
Total individual Medicare ........... 3,131,000 3,332,000 (201,000) (6.0)%
Individual commercial .................. 411,200 397,400 13,800 3.5%
Total individual medical members .... 3,542,200 3,729,400 (187,200) (5.0)%
Individual specialty membership (a) ........... 510,000 297,300 212,700 71.5%
(a) Specialty products include dental, vision, and other supplemental health and financial protection products.
Members included in these products may not be unique to each product since members have the ability to
enroll in multiple products.
56