Humana 2011 Annual Report Download - page 2
Download and view the complete annual report
Please find page 2 of the 2011 Humana annual report below. You can navigate through the pages in the report by either clicking on the pages listed below, or by using the keyword search tool below to find specific information within the annual report.-
 1
1 -
 2
2 -
 3
3 -
 4
4 -
 5
5 -
 6
6 -
 7
7 -
 8
8 -
 9
9 -
 10
10 -
 11
11 -
 12
12 -
 13
13 -
14
-
15
-
16
-
17
-
18
-
19
-
20
-
21
-
22
-
23
-
24
-
25
-
26
-
27
-
28
-
29
-
30
-
31
-
32
-
33
-
34
-
35
-
36
-
37
-
38
-
39
-
40
-
41
-
42
-
43
-
44
-
45
-
46
-
47
-
48
-
49
-
50
-
51
-
52
-
53
-
54
-
55
-
56
-
57
-
58
-
59
-
60
-
61
-
62
-
63
-
64
-
65
-
66
-
67
-
68
-
69
-
70
-
71
-
72
-
73
-
74
-
75
-
76
-
77
-
78
-
79
-
80
-
81
-
82
-
83
-
84
-
85
-
86
-
87
-
88
-
89
-
90
-
91
-
92
-
93
-
94
-
95
-
96
-
97
-
98
-
99
-
100
-
101
-
102
-
103
-
104
-
105
-
106
-
107
-
108
-
109
-
110
-
111
-
112
-
113
-
114
-
115
-
116
-
117
-
118
-
119
-
120
-
121
-
122
-
123
-
124
-
125
-
126
-
127
-
128
-
129
-
130
-
131
-
132
-
133
-
134
-
135
-
136
-
137
-
138
-
139
-
140
-
141
-
142
-
143
-
144
-
145
-
146
-
147
-
148
-
149
-
150
-
151
-
152
-
153
-
154
-
155
-
156
-
157
-
158
-
159
-
160
 |
 |

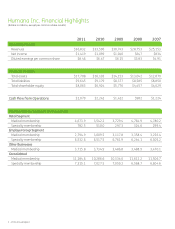
1 – 2011 Annual Report
2011 2010 2009 2008 2007
Operating Results
Revenues $36,832 $33,596 $30,743 $28,753 $25,153
Net income $1,419 $1,099 $1,040 $647 $834
Diluted earnings per common share $8.46 $6.47 $6.15 $3.83 $4.91
Financial Position
Total assets $17,708 $16,103 $14,153 $13,042 $12,879
Total liabilities $9,645 $9,179 $8,377 $8,585 $8,850
Total shareholder equity $8,063 $6,924 $5,776 $4,457 $4,029
Cash Flow from Operations $2,079 $2,242 $1,422 $982 $1,224
Membership by Segment (in thousands)
Retail Segment
Medical membership 4,673.9 3,542.2 3,729.4 4,764.9 4,780.2
Specialty membership 782.5 510.0 297.3 324.6 299.4
Employer Group Segment
Medical membership 2,794.9 3,009.5 3,117.8 3,358.4 3,256.4
Specialty membership 6,532.6 6,517.5 6,761.9 6,244.1 6,305.2
Other Businesses
Medical membership 3,715.8 3,734.9 3,486.8 3,488.9 3,470.1
Consolidated
Medical membership 11,184.6 10,286.6 10,334.0 11,612.2 11,506.7
Specialty membership 7,315.1 7,027.5 7,059.2 6,568.7 6,604.6
Humana Inc. Financial Highlights
(dollars in millions, except per common share results)