Humana 2011 Annual Report Download - page 67
Download and view the complete annual report
Please find page 67 of the 2011 Humana annual report below. You can navigate through the pages in the report by either clicking on the pages listed below, or by using the keyword search tool below to find specific information within the annual report.-
 1
1 -
2
-
3
-
4
-
5
-
6
-
7
-
8
-
9
-
10
-
11
-
12
-
13
-
14
-
15
-
16
-
17
-
18
-
19
-
20
-
21
-
22
-
23
-
24
-
25
-
26
-
27
-
28
-
29
-
30
-
31
-
32
-
33
-
34
-
35
-
36
-
37
-
38
-
39
-
40
-
41
-
42
-
43
-
44
-
45
-
46
-
47
-
48
-
49
-
50
-
51
-
52
-
53
-
54
-
55
-
56
-
 57
57 -
 58
58 -
 59
59 -
 60
60 -
 61
61 -
 62
62 -
 63
63 -
 64
64 -
 65
65 -
 66
66 -
 67
67 -
 68
68 -
 69
69 -
 70
70 -
 71
71 -
 72
72 -
 73
73 -
 74
74 -
 75
75 -
 76
76 -
 77
77 -
78
-
79
-
80
-
81
-
82
-
83
-
84
-
85
-
86
-
87
-
88
-
89
-
90
-
91
-
92
-
93
-
94
-
95
-
96
-
97
-
98
-
99
-
100
-
101
-
102
-
103
-
104
-
105
-
106
-
107
-
108
-
109
-
110
-
111
-
112
-
113
-
114
-
115
-
116
-
117
-
118
-
119
-
120
-
121
-
122
-
123
-
124
-
125
-
126
-
127
-
128
-
129
-
130
-
131
-
132
-
133
-
134
-
135
-
136
-
137
-
138
-
139
-
140
-
141
-
142
-
143
-
144
-
145
-
146
-
147
-
148
-
149
-
150
-
151
-
152
-
153
-
154
-
155
-
156
-
157
-
158
-
159
-
160
 |
 |

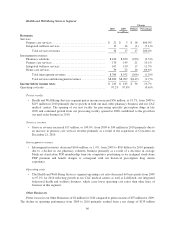
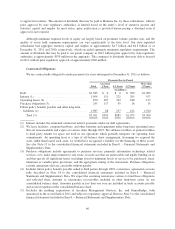
Change
2010 2009 Dollars Percentage
(dollars in millions)
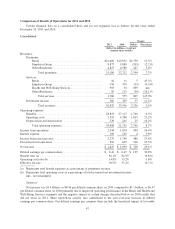
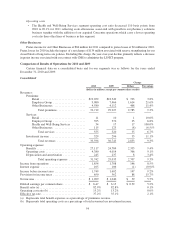
Premiums and Services Revenue:
Premiums:
Individual Medicare Advantage ............ $16,265 $15,333 $ 932 6.1%
Individual Medicare stand-alone PDP ....... 1,959 2,323 (364) (15.7)%
Total individual Medicare ............ 18,224 17,656 568 3.2%
Individual commercial ................... 746 638 108 16.9%
Individual specialty ..................... 82 55 27 49.1%
Total premiums .................... 19,052 18,349 703 3.8%
Services .............................. 11 10 1 10.0%
Total premiums and services revenue . . . $19,063 $18,359 $ 704 3.8%
Income before income taxes $ 1,289 $ 1,359 $ (70) (5.2)%
Benefit ratio ................................... 82.0% 81.7% 0.3%
Operating cost ratio ............................. 11.1% 10.8% 0.3%
Pretax Results
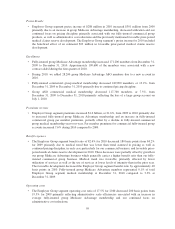
• Retail segment pretax income was $1.3 billion in 2010, a decrease of $70 million, or 5.2%, from 2009
primarily due to the negative impact of a $147 million write-down of deferred acquisition costs
associated with our individual commercial medical policies in 2010 and a decline in average individual
Medicare stand-alone PDP membership from 2009 to 2010, partially offset by the beneficial impact of
an estimated $198 million in favorable prior-period medical claims reserve development in 2010.
Enrollment
• Individual Medicare Advantage membership increased 54,100 members, or 3.8%, from December 31,
2009 to December 31, 2010, with sales of our PPO products driving the majority of the increase.
• Individual Medicare stand-alone PDP membership decreased 255,100 members, or 13.2%, from
December 31, 2009 to December 31, 2010 primarily from our competitive positioning as we realigned
stand-alone PDP premium and benefit designs to correspond with our historical prescription drug
claims experience.
• Individual specialty membership increased 212,700, or 71.5%, from December 31, 2009 to
December 31, 2010, primarily driven by increased sales in dental and vision offerings.
Premiums revenue
• Retail segment premiums increased $703 million, or 3.8%, from 2009 to 2010 primarily due to higher
average individual Medicare Advantage membership and an increase in per member premiums,
partially offset by a decline in average individual stand-alone PDP membership. Individual Medicare
Advantage premiums revenue increased $932 million, or 6.1%, from 2009 to 2010. Average individual
Medicare Advantage membership increased 4.4% in 2010 compared to 2009. Individual Medicare
Advantage per member premiums increased approximately 1.6% during 2010 compared to 2009.
Individual Medicare stand-alone PDP premiums revenue decreased $364 million, or 15.7%, from 2009
to 2010 primarily due to a 14.8% decrease in average individual PDP membership.
Benefit expenses
• The Retail segment benefit ratio increased 30 basis points from 81.7% in 2009 to 82.0% in 2010
primarily driven by a 40 basis point increase in the Medicare benefit ratio primarily as a result of
57