Humana 2011 Annual Report Download - page 121
Download and view the complete annual report
Please find page 121 of the 2011 Humana annual report below. You can navigate through the pages in the report by either clicking on the pages listed below, or by using the keyword search tool below to find specific information within the annual report.-
 1
1 -
2
-
3
-
4
-
5
-
6
-
7
-
8
-
9
-
10
-
11
-
12
-
13
-
14
-
15
-
16
-
17
-
18
-
19
-
20
-
21
-
22
-
23
-
24
-
25
-
26
-
27
-
28
-
29
-
30
-
31
-
32
-
33
-
34
-
35
-
36
-
37
-
38
-
39
-
40
-
41
-
42
-
43
-
44
-
45
-
46
-
47
-
48
-
49
-
50
-
51
-
52
-
53
-
54
-
55
-
56
-
57
-
58
-
59
-
60
-
61
-
62
-
63
-
64
-
65
-
66
-
67
-
68
-
69
-
70
-
71
-
72
-
73
-
74
-
75
-
76
-
77
-
78
-
79
-
80
-
81
-
82
-
83
-
84
-
85
-
86
-
87
-
88
-
89
-
90
-
91
-
92
-
93
-
94
-
95
-
96
-
97
-
98
-
99
-
100
-
101
-
102
-
103
-
104
-
105
-
106
-
107
-
108
-
109
-
110
-
 111
111 -
 112
112 -
 113
113 -
 114
114 -
 115
115 -
 116
116 -
 117
117 -
 118
118 -
 119
119 -
 120
120 -
 121
121 -
 122
122 -
 123
123 -
 124
124 -
 125
125 -
 126
126 -
 127
127 -
 128
128 -
 129
129 -
 130
130 -
 131
131 -
132
-
133
-
134
-
135
-
136
-
137
-
138
-
139
-
140
-
141
-
142
-
143
-
144
-
145
-
146
-
147
-
148
-
149
-
150
-
151
-
152
-
153
-
154
-
155
-
156
-
157
-
158
-
159
-
160
 |
 |

Humana Inc.
NOTES TO CONSOLIDATED FINANCIAL STATEMENTS—(Continued)
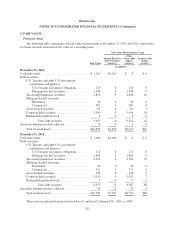
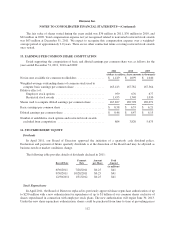
We calculate the expected term for our employee stock options based on historical employee exercise
behavior and base the risk-free interest rate on a traded zero-coupon U.S. Treasury bond with a term substantially
equal to the option’s expected term.
The volatility used to value employee stock options is based on historical volatility. We calculate historical
volatility using a simple-average calculation methodology based on daily price intervals as measured over the
expected term of the option.
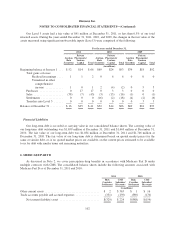
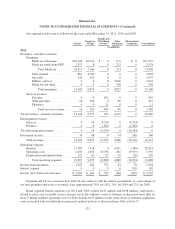
Activity for our option plans was as follows for the year ended December 31, 2011:
Shares Under
Option
Weighted-Average
Exercise Price
(shares in thousands)
Options outstanding at December 31, 2010 .............................. 5,795 $46.86
Granted ...................................................... 448 71.79
Exercised ..................................................... (3,079) 43.63
Forfeited ..................................................... (20) 43.66
Options outstanding at December 31, 2011 .............................. 3,144 $53.60
Options exercisable at December 31, 2011 .............................. 1,552 $55.68
As of December 31, 2011, outstanding stock options, substantially all of which are expected to vest, had an
aggregate intrinsic value of $108 million, and a weighted-average remaining contractual term of 3.7 years. As of
December 31, 2011, exercisable stock options had an aggregate intrinsic value of $50 million, and a weighted-
average remaining contractual term of 2.5 years. The total intrinsic value of stock options exercised during 2011
was $88 million, compared with $11 million during 2010 and $24 million during 2009. Cash received from stock
option exercises totaled $134 million in 2011, $17 million in 2010, and $18 million in 2009.
Total compensation expense not yet recognized related to nonvested options was $13 million at
December 31, 2011. We expect to recognize this compensation expense over a weighted-average period of
approximately 2.1 years.
Restricted Stock Awards
Restricted stock awards are granted with a fair value equal to the market price of our common stock on the
date of grant and generally vest three years from the date of grant. The weighted-average grant date fair value of
our restricted stock awards was $67.70 in 2011, $49.29 in 2010, and $41.16 in 2009. Activity for our restricted
stock awards was as follows for the year ended December 31, 2011:
Shares
Weighted-
Average
Grant-Date
Fair Value
(shares in thousands)
Nonvested restricted stock awards at December 31, 2010 . . . 2,459 $51.38
Granted ...................................... 1,291 67.70
Vested ....................................... (584) 67.87
Forfeited ..................................... (250) 56.70
Nonvested restricted stock awards at December 31, 2011 . . . 2,916 $53.93
111