Humana 2011 Annual Report Download - page 131
Download and view the complete annual report
Please find page 131 of the 2011 Humana annual report below. You can navigate through the pages in the report by either clicking on the pages listed below, or by using the keyword search tool below to find specific information within the annual report.-
 1
1 -
2
-
3
-
4
-
5
-
6
-
7
-
8
-
9
-
10
-
11
-
12
-
13
-
14
-
15
-
16
-
17
-
18
-
19
-
20
-
21
-
22
-
23
-
24
-
25
-
26
-
27
-
28
-
29
-
30
-
31
-
32
-
33
-
34
-
35
-
36
-
37
-
38
-
39
-
40
-
41
-
42
-
43
-
44
-
45
-
46
-
47
-
48
-
49
-
50
-
51
-
52
-
53
-
54
-
55
-
56
-
57
-
58
-
59
-
60
-
61
-
62
-
63
-
64
-
65
-
66
-
67
-
68
-
69
-
70
-
71
-
72
-
73
-
74
-
75
-
76
-
77
-
78
-
79
-
80
-
81
-
82
-
83
-
84
-
85
-
86
-
87
-
88
-
89
-
90
-
91
-
92
-
93
-
94
-
95
-
96
-
97
-
98
-
99
-
100
-
101
-
102
-
103
-
104
-
105
-
106
-
107
-
108
-
109
-
110
-
111
-
112
-
113
-
114
-
115
-
116
-
117
-
118
-
119
-
120
-
 121
121 -
 122
122 -
 123
123 -
 124
124 -
 125
125 -
 126
126 -
 127
127 -
 128
128 -
 129
129 -
 130
130 -
 131
131 -
 132
132 -
 133
133 -
 134
134 -
 135
135 -
 136
136 -
 137
137 -
 138
138 -
 139
139 -
 140
140 -
 141
141 -
142
-
143
-
144
-
145
-
146
-
147
-
148
-
149
-
150
-
151
-
152
-
153
-
154
-
155
-
156
-
157
-
158
-
159
-
160
 |
 |

Humana Inc.
NOTES TO CONSOLIDATED FINANCIAL STATEMENTS—(Continued)
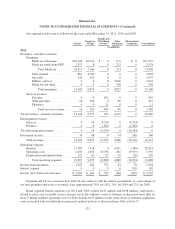
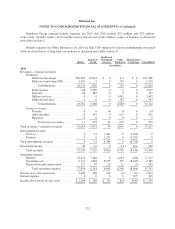
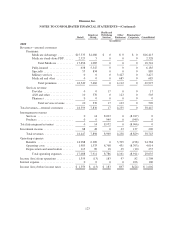
Our segment results were as follows for the years ended December 31, 2011, 2010, and 2009:
Retail
Employer
Group
Health and
Well-Being
Services
Other
Businesses
Eliminations/
Corporate Consolidated
(in millions)
2011
Revenues—external customers
Premiums:
Medicare Advantage ........ $18,100 $3,152 $ 0 $ 0 $ 0 $21,252
Medicare stand-alone PDP .... 2,317 8 0 253 0 2,578
Total Medicare ......... 20,417 3,160 0 253 0 23,830
Fully-insured .............. 861 4,782 0 0 0 5,643
Specialty .................. 124 935 0 0 0 1,059
Military services ........... 0 0 0 3,616 0 3,616
Medicaid and other ......... 0 0 0 958 0 958
Total premiums ........ 21,402 8,877 0 4,827 0 35,106
Services revenue:
Provider .................. 0 0 892 0 0 892
ASO and other ............. 16 356 0 85 0 457
Pharmacy ................. 0 0 11 0 0 11
Total services revenue . . . 16 356 903 85 0 1,360
Total revenues—external customers .... 21,418 9,233 903 4,912 0 36,466
Intersegment revenues
Services ...................... 0 14 8,510 0 (8,524) 0
Products ...................... 0 0 1,820 0 (1,820) 0
Total intersegment revenues .......... 0 14 10,330 0 (10,344) 0
Investment income .................. 76 48 0 54 188 366
Total revenues ................. 21,494 9,295 11,233 4,966 (10,156) 36,832
Operating expenses:
Benefits ...................... 17,383 7,318 0 4,411 (289) 28,823
Operating costs ................ 2,405 1,650 10,798 461 (9,919) 5,395
Depreciation and amortization ..... 119 85 82 10 (26) 270
Total operating expenses ..... 19,907 9,053 10,880 4,882 (10,234) 34,488
Income from operations .............. 1,587 242 353 84 78 2,344
Interest expense .................... 0 0 0 0 109 109
Income (loss) before income taxes ..... $ 1,587 $ 242 $ 353 $84 $(31) $ 2,235
Premium and services revenues derived from our contracts with the federal government, as a percentage of
our total premium and services revenues, were approximately 76% for 2011, 76% for 2010 and 73% for 2009.
Retail segment benefit expenses for 2011 and 2010 include $147 million and $198 million, respectively,
related to prior year favorable reserve releases not in the ordinary course of business as discussed more fully in
Note 9. Retail segment operating costs for 2010 include $147 million for the write-down of deferred acquisition
costs associated with our individual commercial medical policies as discussed more fully in Note 17.
121