Humana 2011 Annual Report Download - page 70
Download and view the complete annual report
Please find page 70 of the 2011 Humana annual report below. You can navigate through the pages in the report by either clicking on the pages listed below, or by using the keyword search tool below to find specific information within the annual report.-
 1
1 -
2
-
3
-
4
-
5
-
6
-
7
-
8
-
9
-
10
-
11
-
12
-
13
-
14
-
15
-
16
-
17
-
18
-
19
-
20
-
21
-
22
-
23
-
24
-
25
-
26
-
27
-
28
-
29
-
30
-
31
-
32
-
33
-
34
-
35
-
36
-
37
-
38
-
39
-
40
-
41
-
42
-
43
-
44
-
45
-
46
-
47
-
48
-
49
-
50
-
51
-
52
-
53
-
54
-
55
-
56
-
57
-
58
-
59
-
 60
60 -
 61
61 -
 62
62 -
 63
63 -
 64
64 -
 65
65 -
 66
66 -
 67
67 -
 68
68 -
 69
69 -
 70
70 -
 71
71 -
 72
72 -
 73
73 -
 74
74 -
 75
75 -
 76
76 -
 77
77 -
 78
78 -
 79
79 -
 80
80 -
81
-
82
-
83
-
84
-
85
-
86
-
87
-
88
-
89
-
90
-
91
-
92
-
93
-
94
-
95
-
96
-
97
-
98
-
99
-
100
-
101
-
102
-
103
-
104
-
105
-
106
-
107
-
108
-
109
-
110
-
111
-
112
-
113
-
114
-
115
-
116
-
117
-
118
-
119
-
120
-
121
-
122
-
123
-
124
-
125
-
126
-
127
-
128
-
129
-
130
-
131
-
132
-
133
-
134
-
135
-
136
-
137
-
138
-
139
-
140
-
141
-
142
-
143
-
144
-
145
-
146
-
147
-
148
-
149
-
150
-
151
-
152
-
153
-
154
-
155
-
156
-
157
-
158
-
159
-
160
 |
 |

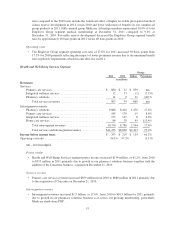
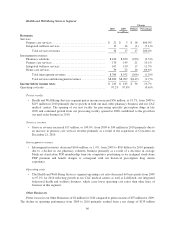
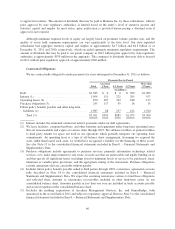
Health and Well-Being Services Segment
Change
2010 2009 Dollars Percentage
(in millions)
Revenues:
Services:
Primary care services .................................... $ 21 $ 3 $ 18 600.0%
Integrated wellness services ............................... 13 14 (1) (7.1)%
Total services revenues .............................. 34 17 17 100.0%
Intersegment revenues:
Pharmacy solutions ..................................... 8,410 8,630 (220) (2.5)%
Primary care services .................................... 170 149 21 14.1%
Integrated wellness services ............................... 167 150 17 11.3%
Home care services ..................................... 39 23 16 69.6%
Total intersegment revenues .......................... 8,786 8,952 (166) (1.9)%
Total services and intersegment revenues ................ $8,820 $8,969 $(149) (1.7)%
Income before income taxes $ 219 $ 183 $ 36 19.7%
Operating cost ratio ......................................... 97.2% 97.8% (0.6)%
Pretax results
• Health and Well-Being Services segment pretax income increased $36 million, or 19.7%, from 2009 to
$219 million in 2010 primarily due to growth in both our mail order pharmacy business and our CAC
medical centers. The opening of our new facility for processing specialty prescription drugs in late
2009 and continued growth from our processing facility opened in 2008 contributed to the growth in
our mail order business in 2010.
Services revenue
• Services revenue increased $17 million, or 100.0%, from 2009 to $34 million in 2010 primarily due to
an increase in primary care services revenue primarily as a result of the acquisition of Concentra on
December 21, 2010.
Intersegment revenues
• Intersegment revenues decreased $166 million, or 1.9%, from 2009 to $8.8 billion for 2010 primarily
due to a decline in our pharmacy solutions business primarily as a result of a decrease in average
Medicare stand-alone PDP membership from our competitive positioning as we realigned stand-alone
PDP premium and benefit designs to correspond with our historical prescription drug claims
experience.
Operating costs
• The Health and Well-Being Services segment operating cost ratio decreased 60 basis points from 2009
to 97.2% for 2010 reflecting growth in our CAC medical centers as well as LifeSynch, our integrated
behavioral health and wellness business, which carry lower operating cost ratios than other lines of
business in this segment.
Other Businesses
Pretax losses for our Other Businesses of $2 million for 2010 compared to pretax income of $97 million for 2009.
The decline in operating performance from 2009 to 2010 primarily resulted from a net charge of $139 million
60