Humana 2011 Annual Report Download - page 120
Download and view the complete annual report
Please find page 120 of the 2011 Humana annual report below. You can navigate through the pages in the report by either clicking on the pages listed below, or by using the keyword search tool below to find specific information within the annual report.-
 1
1 -
2
-
3
-
4
-
5
-
6
-
7
-
8
-
9
-
10
-
11
-
12
-
13
-
14
-
15
-
16
-
17
-
18
-
19
-
20
-
21
-
22
-
23
-
24
-
25
-
26
-
27
-
28
-
29
-
30
-
31
-
32
-
33
-
34
-
35
-
36
-
37
-
38
-
39
-
40
-
41
-
42
-
43
-
44
-
45
-
46
-
47
-
48
-
49
-
50
-
51
-
52
-
53
-
54
-
55
-
56
-
57
-
58
-
59
-
60
-
61
-
62
-
63
-
64
-
65
-
66
-
67
-
68
-
69
-
70
-
71
-
72
-
73
-
74
-
75
-
76
-
77
-
78
-
79
-
80
-
81
-
82
-
83
-
84
-
85
-
86
-
87
-
88
-
89
-
90
-
91
-
92
-
93
-
94
-
95
-
96
-
97
-
98
-
99
-
100
-
101
-
102
-
103
-
104
-
105
-
106
-
107
-
108
-
109
-
 110
110 -
 111
111 -
 112
112 -
 113
113 -
 114
114 -
 115
115 -
 116
116 -
 117
117 -
 118
118 -
 119
119 -
 120
120 -
 121
121 -
 122
122 -
 123
123 -
 124
124 -
 125
125 -
 126
126 -
 127
127 -
 128
128 -
 129
129 -
 130
130 -
131
-
132
-
133
-
134
-
135
-
136
-
137
-
138
-
139
-
140
-
141
-
142
-
143
-
144
-
145
-
146
-
147
-
148
-
149
-
150
-
151
-
152
-
153
-
154
-
155
-
156
-
157
-
158
-
159
-
160
 |
 |

Humana Inc.
NOTES TO CONSOLIDATED FINANCIAL STATEMENTS—(Continued)
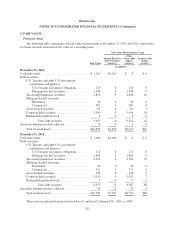
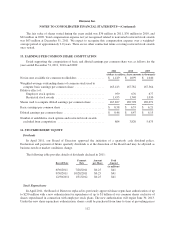
compensation expense that has been charged against income for these plans was as follows for the years ended
December 31, 2011, 2010, and 2009:
2011 2010 2009
(in millions)
Stock-based compensation expense by type:
Stock options ................................................ $16 $22 $20
Restricted stock awards ........................................ 51 41 46
Total stock-based compensation expense ...................... 67 63 66
Tax benefit recognized .................................... (25) (23) (24)
Stock-based compensation expense, net of tax .............. $42 $40 $42
The tax benefit recognized in our consolidated financial statements is based on the amount of compensation
expense recorded for book purposes. The actual tax benefit realized in our tax return is based on the intrinsic
value, or the excess of the market value over the exercise or purchase price, of stock options exercised and
restricted stock awards vested during the period. The actual tax benefit realized for the deductions taken on our
tax returns from option exercises and restricted stock award vesting totaled $44 million in 2011, $15 million in
2010, and $16 million in 2009. There was no capitalized stock-based compensation expense during these years.
At December 31, 2011, there were 27.8 million shares reserved for stock award plans, including
19.5 million shares of common stock available for future grants assuming all stock options or 8.7 million shares
available for future grants assuming all restricted stock awards.
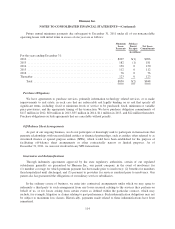
Stock Options
Stock options are granted with an exercise price equal to the fair market value of the underlying common
stock on the date of grant. Our stock plans, as approved by the Board of Directors and stockholders, define fair
market value as the average of the highest and lowest composite stock prices reported by the New York Stock
Exchange on a given date. Exercise provisions vary, but most options vest in whole or in part 1 to 3 years after
grant and expire 7 to 10 years after grant.
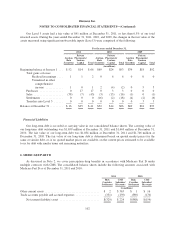
The weighted-average fair value of each option granted during 2011, 2010, and 2009 is provided below. The
fair value was estimated on the date of grant using the Black-Scholes pricing model with the weighted-average
assumptions indicated below:
2011 2010 2009
Weighted-average fair value at grant date ........................ $28.29 $19.58 $14.24
Expected option life (years) ................................... 4.8 5.2 4.6
Expected volatility .......................................... 46.8% 43.8% 39.2%
Risk-free interest rate at grant date ............................. 1.7% 2.7% 1.9%
Dividend yield(1) ........................................... 0.5% None None
(1) As discussed in Note 14, in April 2011, our Board of Directors approved the initiation of a quarterly cash
dividend policy.
When valuing employee stock options, we stratify the employee population into three homogenous groups
that historically have exhibited similar exercise behaviors. These groups are executive officers, directors, and all
other employees. We value the stock options based on the unique assumptions for each of these employee
groups.
110