Humana 2011 Annual Report Download - page 62
Download and view the complete annual report
Please find page 62 of the 2011 Humana annual report below. You can navigate through the pages in the report by either clicking on the pages listed below, or by using the keyword search tool below to find specific information within the annual report.-
 1
1 -
2
-
3
-
4
-
5
-
6
-
7
-
8
-
9
-
10
-
11
-
12
-
13
-
14
-
15
-
16
-
17
-
18
-
19
-
20
-
21
-
22
-
23
-
24
-
25
-
26
-
27
-
28
-
29
-
30
-
31
-
32
-
33
-
34
-
35
-
36
-
37
-
38
-
39
-
40
-
41
-
42
-
43
-
44
-
45
-
46
-
47
-
48
-
49
-
50
-
51
-
 52
52 -
 53
53 -
 54
54 -
 55
55 -
 56
56 -
 57
57 -
 58
58 -
 59
59 -
 60
60 -
 61
61 -
 62
62 -
 63
63 -
 64
64 -
 65
65 -
 66
66 -
 67
67 -
 68
68 -
 69
69 -
 70
70 -
 71
71 -
 72
72 -
73
-
74
-
75
-
76
-
77
-
78
-
79
-
80
-
81
-
82
-
83
-
84
-
85
-
86
-
87
-
88
-
89
-
90
-
91
-
92
-
93
-
94
-
95
-
96
-
97
-
98
-
99
-
100
-
101
-
102
-
103
-
104
-
105
-
106
-
107
-
108
-
109
-
110
-
111
-
112
-
113
-
114
-
115
-
116
-
117
-
118
-
119
-
120
-
121
-
122
-
123
-
124
-
125
-
126
-
127
-
128
-
129
-
130
-
131
-
132
-
133
-
134
-
135
-
136
-
137
-
138
-
139
-
140
-
141
-
142
-
143
-
144
-
145
-
146
-
147
-
148
-
149
-
150
-
151
-
152
-
153
-
154
-
155
-
156
-
157
-
158
-
159
-
160
 |
 |

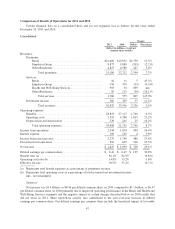
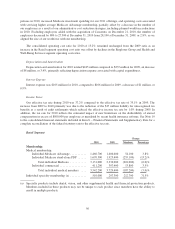
Change
2011 2010 Dollars Percentage
(in millions)
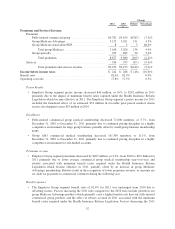
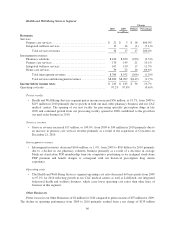
Premiums and Services Revenue:
Premiums:
Fully-insured commercial group ....................... $4,782 $5,169 $(387) (7.5)%
Group Medicare Advantage ........................... 3,152 3,021 131 4.3%
Group Medicare stand-alone PDP ...................... 8 5 3 60.0%
Total group Medicare ............................ 3,160 3,026 134 4.4%
Group specialty .................................... 935 885 50 5.6%
Total premiums ................................ 8,877 9,080 (203) (2.2)%
Services .............................................. 356 395 (39) (9.9)%
Total premiums and services revenue ............... $9,233 $9,475 $(242) (2.6)%
Income before income taxes $ 242 $ 288 $ (46) (16.0)%
Benefit ratio ............................................... 82.4% 82.4% 0.0%
Operating cost ratio ......................................... 17.8% 17.5% 0.3%
Pretax Results
• Employer Group segment pretax income decreased $46 million, or 16%, to $242 million in 2011
primarily due to the impact of minimum benefit ratios required under the Health Insurance Reform
Legislation which became effective in 2011. The Employer Group segment’s pretax income for 2011
included the beneficial effect of an estimated $52 million in favorable prior-period medical claims
reserve development versus $33 million in 2010.
Enrollment
• Fully-insured commercial group medical membership decreased 72,000 members, or 5.7%, from
December 31, 2010 to December 31, 2011 primarily due to continued pricing discipline in a highly
competitive environment for large group business partially offset by small group business membership
gains.
• Group ASO commercial medical membership decreased 161,300 members, or 11.1%, from
December 31, 2010 to December 31, 2011 primarily due to continued pricing discipline in a highly
competitive environment for self-funded accounts.
Premiums revenue
• Employer Group segment premiums decreased by $203 million, or 2.2%, from 2010 to $8.9 billion for
2011 primarily due to lower average commercial group medical membership year-over-year and
rebates associated with minimum benefit ratios required under the Health Insurance Reform
Legislation which became effective in 2011, partially offset by an increase in group Medicare
Advantage membership. Rebates result in the recognition of lower premiums revenue, as amounts are
set aside for payments to commercial customers during the following year.
Benefit expenses
• The Employer Group segment benefit ratio of 82.4% for 2011 was unchanged from 2010 due to
offsetting factors. Factors increasing the 2011 ratio compared to the 2010 ratio include growth in our
group Medicare Advantage products which generally carry a higher benefit ratio than our fully-insured
commercial group products and the effect of rebates accrued in 2011 associated with the minimum
benefit ratios required under the Health Insurance Reform Legislation. Factors decreasing the 2011
52