Humana 2011 Annual Report Download - page 48
Download and view the complete annual report
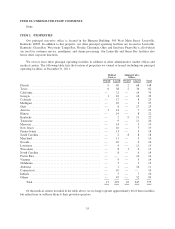
Please find page 48 of the 2011 Humana annual report below. You can navigate through the pages in the report by either clicking on the pages listed below, or by using the keyword search tool below to find specific information within the annual report.-
 1
1 -
2
-
3
-
4
-
5
-
6
-
7
-
8
-
9
-
10
-
11
-
12
-
13
-
14
-
15
-
16
-
17
-
18
-
19
-
20
-
21
-
22
-
23
-
24
-
25
-
26
-
27
-
28
-
29
-
30
-
31
-
32
-
33
-
34
-
35
-
36
-
37
-
 38
38 -
 39
39 -
 40
40 -
 41
41 -
 42
42 -
 43
43 -
 44
44 -
 45
45 -
 46
46 -
 47
47 -
 48
48 -
 49
49 -
 50
50 -
 51
51 -
 52
52 -
 53
53 -
 54
54 -
 55
55 -
 56
56 -
 57
57 -
 58
58 -
59
-
60
-
61
-
62
-
63
-
64
-
65
-
66
-
67
-
68
-
69
-
70
-
71
-
72
-
73
-
74
-
75
-
76
-
77
-
78
-
79
-
80
-
81
-
82
-
83
-
84
-
85
-
86
-
87
-
88
-
89
-
90
-
91
-
92
-
93
-
94
-
95
-
96
-
97
-
98
-
99
-
100
-
101
-
102
-
103
-
104
-
105
-
106
-
107
-
108
-
109
-
110
-
111
-
112
-
113
-
114
-
115
-
116
-
117
-
118
-
119
-
120
-
121
-
122
-
123
-
124
-
125
-
126
-
127
-
128
-
129
-
130
-
131
-
132
-
133
-
134
-
135
-
136
-
137
-
138
-
139
-
140
-
141
-
142
-
143
-
144
-
145
-
146
-
147
-
148
-
149
-
150
-
151
-
152
-
153
-
154
-
155
-
156
-
157
-
158
-
159
-
160
 |
 |

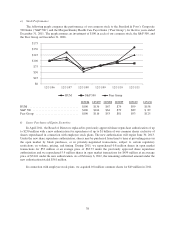
e) Stock Performance
The following graph compares the performance of our common stock to the Standard & Poor’s Composite
500 Index (“S&P 500”) and the Morgan Stanley Health Care Payer Index (“Peer Group”) for the five years ended
December 31, 2011. The graph assumes an investment of $100 in each of our common stock, the S&P 500, and
the Peer Group on December 31, 2006.
$0
$25
$50
$75
$100
$125
$175
$150
12/31/06
HUM S&P 500 Peer Group
12/31/07 12/31/08 12/31/09 12/31/10 12/31/11
12/31/06 12/31/07 12/31/08 12/31/09 12/31/10 12/31/11
HUM .................................. $100 $136 $67 $79 $99 $158
S&P500 ............................... $100 $104 $64 $79 $89 $ 89
Peer Group ............................. $100 $116 $53 $81 $93 $125
f) Issuer Purchases of Equity Securities
In April 2011, the Board of Directors replaced its previously approved share repurchase authorization of up
to $250 million with a new authorization for repurchases of up to $1 billion of our common shares exclusive of
shares repurchased in connection with employee stock plans. The new authorization will expire June 30, 2013.
Under the new share repurchase authorization, shares may be purchased from time to time at prevailing prices in
the open market by block purchases, or in privately-negotiated transactions, subject to certain regulatory
restrictions on volume, pricing, and timing. During 2011, we repurchased 0.8 million shares in open market
transactions for $53 million at an average price of $63.73 under the previously approved share repurchase
authorization and we repurchased 5.9 million shares in open market transactions for $439 million at an average
price of $74.01 under the new authorization. As of February 6, 2012, the remaining authorized amount under the
new authorization totaled $561 million.
In connection with employee stock plans, we acquired 0.8 million common shares for $49 million in 2011.
38