Humana 2011 Annual Report Download - page 49
Download and view the complete annual report
Please find page 49 of the 2011 Humana annual report below. You can navigate through the pages in the report by either clicking on the pages listed below, or by using the keyword search tool below to find specific information within the annual report.-
 1
1 -
2
-
3
-
4
-
5
-
6
-
7
-
8
-
9
-
10
-
11
-
12
-
13
-
14
-
15
-
16
-
17
-
18
-
19
-
20
-
21
-
22
-
23
-
24
-
25
-
26
-
27
-
28
-
29
-
30
-
31
-
32
-
33
-
34
-
35
-
36
-
37
-
38
-
 39
39 -
 40
40 -
 41
41 -
 42
42 -
 43
43 -
 44
44 -
 45
45 -
 46
46 -
 47
47 -
 48
48 -
 49
49 -
 50
50 -
 51
51 -
 52
52 -
 53
53 -
 54
54 -
 55
55 -
 56
56 -
 57
57 -
 58
58 -
 59
59 -
60
-
61
-
62
-
63
-
64
-
65
-
66
-
67
-
68
-
69
-
70
-
71
-
72
-
73
-
74
-
75
-
76
-
77
-
78
-
79
-
80
-
81
-
82
-
83
-
84
-
85
-
86
-
87
-
88
-
89
-
90
-
91
-
92
-
93
-
94
-
95
-
96
-
97
-
98
-
99
-
100
-
101
-
102
-
103
-
104
-
105
-
106
-
107
-
108
-
109
-
110
-
111
-
112
-
113
-
114
-
115
-
116
-
117
-
118
-
119
-
120
-
121
-
122
-
123
-
124
-
125
-
126
-
127
-
128
-
129
-
130
-
131
-
132
-
133
-
134
-
135
-
136
-
137
-
138
-
139
-
140
-
141
-
142
-
143
-
144
-
145
-
146
-
147
-
148
-
149
-
150
-
151
-
152
-
153
-
154
-
155
-
156
-
157
-
158
-
159
-
160
 |
 |

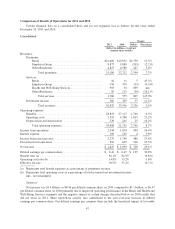
ITEM 6. SELECTED FINANCIAL DATA
2011 (a) 2010 (b) 2009 2008 (c) 2007 (d)
(dollars in millions, except per common share results)
Summary of Operating Results:
Revenues:
Premiums ......................... $ 35,106 $ 32,712 $ 29,927 $ 28,065 $ 24,434
Services .......................... 1,360 555 520 468 405
Investment income ................. 366 329 296 220 314
Total revenues ................. 36,832 33,596 30,743 28,753 25,153
Operating expenses:
Benefits .......................... 28,823 27,117 24,784 23,730 20,246
Operating costs .................... 5,395 4,380 4,014 3,740 3,372
Depreciation and amortization ........ 270 245 237 210 177
Total operating expenses ......... 34,488 31,742 29,035 27,680 23,795
Income from operations ................. 2,344 1,854 1,708 1,073 1,358
Interest expense ........................ 109 105 106 80 69
Income before income taxes .............. 2,235 1,749 1,602 993 1,289
Provision for income taxes ............... 816 650 562 346 455
Net income ........................... $ 1,419 $ 1,099 $ 1,040 $ 647 $ 834
Basic earnings per common share .......... $ 8.58 $ 6.55 $ 6.21 $ 3.87 $ 5.00
Diluted earnings per common share ........ $ 8.46 $ 6.47 $ 6.15 $ 3.83 $ 4.91
Dividends declared per common share ...... $ 0.75 $ 0.00 $ 0.00 $ 0.00 $ 0.00
Financial Position:
Cash and investments ................... $ 10,830 $ 10,046 $ 9,111 $ 7,186 $ 6,691
Total assets ........................... 17,708 16,103 14,153 13,042 12,879
Benefits payable ....................... 3,754 3,469 3,222 3,206 2,697
Debt ................................. 1,659 1,669 1,678 1,937 1,688
Stockholders’ equity .................... 8,063 6,924 5,776 4,457 4,029
Cash flows from operations ............. $ 2,079 $ 2,242 $ 1,422 $ 982 $ 1,224
Key Financial Indicators:
Benefit ratio ........................... 82.1 % 82.9 % 82.8 % 84.6 % 82.9 %
Operating cost ratio ..................... 14.8 % 13.2 % 13.2 % 13.1 % 13.6 %
Membership by Segment:
Retail segment:
Medical membership ................ 4,673,900 3,542,200 3,729,400 4,764,900 4,780,200
Specialty membership ............... 782,500 510,000 297,300 324,600 299,400
Employer Group segment:
Medical membership ................ 2,794,900 3,009,500 3,117,800 3,358,400 3,256,400
Specialty membership ............... 6,532,600 6,517,500 6,761,900 6,244,100 6,305,200
Other Businesses:
Medical membership ................ 3,715,800 3,734,900 3,486,800 3,488,900 3,470,100
Consolidated:
Total medical membership ........... 11,184,600 10,286,600 10,334,000 11,612,200 11,506,700
Total specialty membership .......... 7,315,100 7,027,500 7,059,200 6,568,700 6,604,600
(a) Includes the acquired operations of Anvita, Inc. from December 6, 2011 and MD Care, Inc. from
December 30, 2011. Also includes the benefit of $205 million ($130 million after tax, or $0.77 per diluted
common share) of favorable prior-period medical claims reserve development.
39