Humana 2011 Annual Report Download - page 71
Download and view the complete annual report
Please find page 71 of the 2011 Humana annual report below. You can navigate through the pages in the report by either clicking on the pages listed below, or by using the keyword search tool below to find specific information within the annual report.-
 1
1 -
2
-
3
-
4
-
5
-
6
-
7
-
8
-
9
-
10
-
11
-
12
-
13
-
14
-
15
-
16
-
17
-
18
-
19
-
20
-
21
-
22
-
23
-
24
-
25
-
26
-
27
-
28
-
29
-
30
-
31
-
32
-
33
-
34
-
35
-
36
-
37
-
38
-
39
-
40
-
41
-
42
-
43
-
44
-
45
-
46
-
47
-
48
-
49
-
50
-
51
-
52
-
53
-
54
-
55
-
56
-
57
-
58
-
59
-
60
-
 61
61 -
 62
62 -
 63
63 -
 64
64 -
 65
65 -
 66
66 -
 67
67 -
 68
68 -
 69
69 -
 70
70 -
 71
71 -
 72
72 -
 73
73 -
 74
74 -
 75
75 -
 76
76 -
 77
77 -
 78
78 -
 79
79 -
 80
80 -
 81
81 -
82
-
83
-
84
-
85
-
86
-
87
-
88
-
89
-
90
-
91
-
92
-
93
-
94
-
95
-
96
-
97
-
98
-
99
-
100
-
101
-
102
-
103
-
104
-
105
-
106
-
107
-
108
-
109
-
110
-
111
-
112
-
113
-
114
-
115
-
116
-
117
-
118
-
119
-
120
-
121
-
122
-
123
-
124
-
125
-
126
-
127
-
128
-
129
-
130
-
131
-
132
-
133
-
134
-
135
-
136
-
137
-
138
-
139
-
140
-
141
-
142
-
143
-
144
-
145
-
146
-
147
-
148
-
149
-
150
-
151
-
152
-
153
-
154
-
155
-
156
-
157
-
158
-
159
-
160
 |
 |

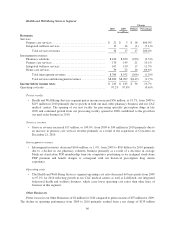
associated with reserve strengthening for our closed block of long-term care policies in 2010, partially offset by pretax
income in 2010 associated with our new contract with CMS to administer the LI-NET program, under which we began
providing services in the first quarter of 2010.
Liquidity
Our primary sources of cash include receipts of premiums, services revenues, and investment and other
income, as well as proceeds from the sale or maturity of our investment securities and borrowings. Our primary
uses of cash include disbursements for claims payments, operating costs, interest on borrowings, taxes, purchases
of investment securities, acquisitions, capital expenditures, repayments on borrowings, dividends, and share
repurchases. Because premiums generally are collected in advance of claim payments by a period of up to several
months, our business normally should produce positive cash flows during periods of increasing premiums and
enrollment. Conversely, cash flows would be negatively impacted during periods of decreasing premiums and
enrollment. From period to period, our cash flows may also be affected by the timing of working capital items.
The use of operating cash flows may be limited by regulatory requirements which require, among other items,
that our regulated subsidiaries maintain minimum levels of capital and seek approval before paying dividends
from the subsidiaries to the parent.
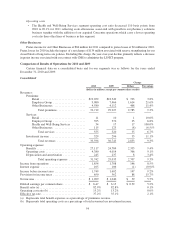
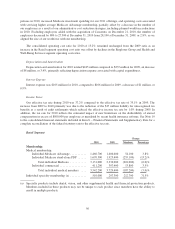
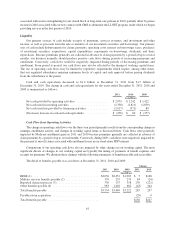
Cash and cash equivalents decreased to $1.4 billion at December 31, 2011 from $1.7 billion at
December 31, 2010. The change in cash and cash equivalents for the years ended December 31, 2011, 2010 and
2009 is summarized as follows:
2011 2010 2009
(in millions)
Net cash provided by operating activities ...................... $2,079 $ 2,242 $ 1,422
Net cash used in investing activities .......................... (1,358) (1,811) (1,859)
Net cash (used in) provided by financing activities ............... (1,017) (371) 80
(Decrease) increase in cash and cash equivalents ................ $ (296) $ 60 $ (357)
Cash Flow from Operating Activities
The change in operating cash flows over the three year period primarily results from the corresponding change in
earnings, enrollment activity, and changes in working capital items as discussed below. Cash flows were positively
impacted by Medicare enrollment gains in 2011 and 2010 because premiums generally are collected in advance of
claim payments by a period of up to several months. Conversely, during 2009, cash flows were negatively impacted by
the payment of run-off claims associated with enrollment losses in our stand-alone PDP business.
Comparisons of our operating cash flows also are impacted by other changes in our working capital. The most
significant drivers of changes in our working capital are typically the timing of payments of benefit expenses and
receipts for premiums. We illustrate these changes with the following summaries of benefits payable and receivables.
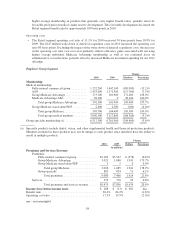
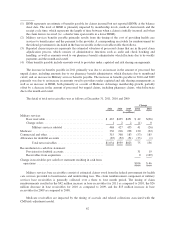
The detail of benefits payable was as follows at December 31, 2011, 2010 and 2009:
Change
2011 2010 2009 2011 2010
(in millions)
IBNR (1) ............................................. $2,056 $2,051 $1,903 $ 5 $148
Military services benefits payable (2) ...................... 339 255 279 84 (24)
Reported claims in process (3) ............................ 376 137 358 239 (221)
Other benefits payable (4) ............................... 983 1,026 682 (43) 344
Total benefits payable .................................. $3,754 $3,469 $3,222 285 247
Payables from acquisition ............................... (29) 0
Total benefits payable .................................. $256 $247
61