Humana 2011 Annual Report Download - page 64
Download and view the complete annual report
Please find page 64 of the 2011 Humana annual report below. You can navigate through the pages in the report by either clicking on the pages listed below, or by using the keyword search tool below to find specific information within the annual report.-
 1
1 -
2
-
3
-
4
-
5
-
6
-
7
-
8
-
9
-
10
-
11
-
12
-
13
-
14
-
15
-
16
-
17
-
18
-
19
-
20
-
21
-
22
-
23
-
24
-
25
-
26
-
27
-
28
-
29
-
30
-
31
-
32
-
33
-
34
-
35
-
36
-
37
-
38
-
39
-
40
-
41
-
42
-
43
-
44
-
45
-
46
-
47
-
48
-
49
-
50
-
51
-
52
-
53
-
 54
54 -
 55
55 -
 56
56 -
 57
57 -
 58
58 -
 59
59 -
 60
60 -
 61
61 -
 62
62 -
 63
63 -
 64
64 -
 65
65 -
 66
66 -
 67
67 -
 68
68 -
 69
69 -
 70
70 -
 71
71 -
 72
72 -
 73
73 -
 74
74 -
75
-
76
-
77
-
78
-
79
-
80
-
81
-
82
-
83
-
84
-
85
-
86
-
87
-
88
-
89
-
90
-
91
-
92
-
93
-
94
-
95
-
96
-
97
-
98
-
99
-
100
-
101
-
102
-
103
-
104
-
105
-
106
-
107
-
108
-
109
-
110
-
111
-
112
-
113
-
114
-
115
-
116
-
117
-
118
-
119
-
120
-
121
-
122
-
123
-
124
-
125
-
126
-
127
-
128
-
129
-
130
-
131
-
132
-
133
-
134
-
135
-
136
-
137
-
138
-
139
-
140
-
141
-
142
-
143
-
144
-
145
-
146
-
147
-
148
-
149
-
150
-
151
-
152
-
153
-
154
-
155
-
156
-
157
-
158
-
159
-
160
 |
 |

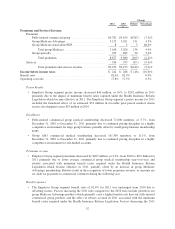
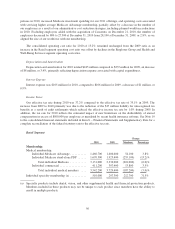
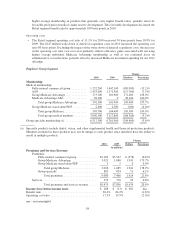
Operating costs
• The Health and Well-Being Services segment operating cost ratio decreased 110 basis points from
2010 to 96.1% for 2011 reflecting scale efficiencies associated with growth in our pharmacy solutions
business together with the addition of our acquired Concentra operations which carry a lower operating
cost ratio than other lines of business in this segment.
Other Businesses
Pretax income for our Other Businesses of $84 million for 2011 compared to pretax losses of $2 million for 2010.
Pretax losses for 2010 include the impact of a net charge of $139 million associated with reserve strengthening for our
closed block of long-term care policies. Excluding this charge, the year-over-year decline primarily reflects a decrease
in pretax income associated with our contract with CMS to administer the LI-NET program.
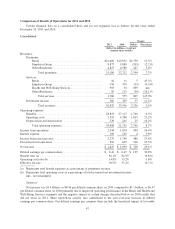
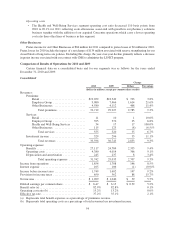
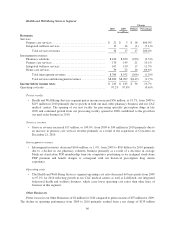
Comparison of Results of Operations for 2010 and 2009
Certain financial data on a consolidated basis and for our segments was as follows for the years ended
December 31, 2010 and 2009:
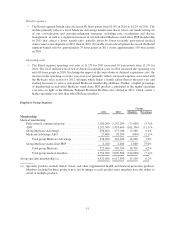
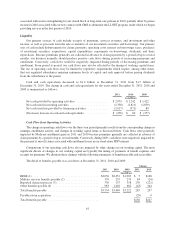
Consolidated
Change
2010 2009 Dollars Percentage
(dollars in millions, except per common share results)
Revenues:
Premiums:
Retail ............................... $19,052 $18,349 $ 703 3.8%
Employer Group ...................... 9,080 7,466 1,614 21.6%
Other Businesses ..................... 4,580 4,112 468 11.4%
Total premiums ................... 32,712 29,927 2,785 9.3%
Services:
Retail ............................... 11 10 1 10.0%
Employer Group ...................... 395 370 25 6.8%
Health and Well-Being Services ......... 34 17 17 100.0%
Other Businesses ..................... 115 123 (8) (6.5)%
Total services .................... 555 520 35 6.7%
Investment income ........................ 329 296 33 11.1%
Total revenues ................... 33,596 30,743 2,853 9.3%
Operating expenses:
Benefits ................................. 27,117 24,784 2,333 9.4%
Operating costs ........................... 4,380 4,014 366 9.1%
Depreciation and amortization ............... 245 237 8 3.4%
Total operating expenses ........... 31,742 29,035 2,707 9.3%
Income from operations ........................ 1,854 1,708 146 8.5%
Interest expense .............................. 105 106 (1) (0.9)%
Income before income taxes ..................... 1,749 1,602 147 9.2%
Provision for income taxes ...................... 650 562 88 15.7%
Net income .................................. $ 1,099 $ 1,040 $ 59 5.7%
Diluted earnings per common share ............... $ 6.47 $ 6.15 $ 0.32 5.2%
Benefit ratio (a) ............................... 82.9% 82.8% 0.1%
Operating cost ratio (b) ......................... 13.2% 13.2% 0.0%
Effective tax rate .............................. 37.2% 35.1% 2.1%
(a) Represents total benefit expenses as a percentage of premiums revenue.
(b) Represents total operating costs as a percentage of total revenues less investment income.
54