Sony 2005 Annual Report Download - page 133
Download and view the complete annual report
Please find page 133 of the 2005 Sony annual report below. You can navigate through the pages in the report by either clicking on the pages listed below, or by using the keyword search tool below to find specific information within the annual report.-
 1
1 -
2
-
3
-
4
-
5
-
6
-
7
-
8
-
9
-
10
-
11
-
12
-
13
-
14
-
15
-
16
-
17
-
18
-
19
-
20
-
21
-
22
-
23
-
24
-
25
-
26
-
27
-
28
-
29
-
30
-
31
-
32
-
33
-
34
-
35
-
36
-
37
-
38
-
39
-
40
-
41
-
42
-
43
-
44
-
45
-
46
-
47
-
48
-
49
-
50
-
51
-
52
-
53
-
54
-
55
-
56
-
57
-
58
-
59
-
60
-
61
-
62
-
63
-
64
-
65
-
66
-
67
-
68
-
69
-
70
-
71
-
72
-
73
-
74
-
75
-
76
-
77
-
78
-
79
-
80
-
81
-
82
-
83
-
84
-
85
-
86
-
87
-
88
-
89
-
90
-
91
-
92
-
93
-
94
-
95
-
96
-
97
-
98
-
99
-
100
-
101
-
102
-
103
-
104
-
105
-
106
-
107
-
108
-
109
-
110
-
111
-
112
-
113
-
114
-
115
-
116
-
117
-
118
-
119
-
120
-
121
-
122
-
 123
123 -
 124
124 -
 125
125 -
 126
126 -
 127
127 -
 128
128 -
 129
129 -
 130
130 -
 131
131 -
 132
132 -
 133
133 -
 134
134 -
 135
135 -
 136
136 -
 137
137
 |
 |
130 Sony Corporation
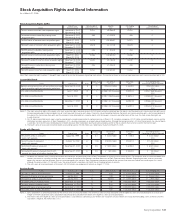
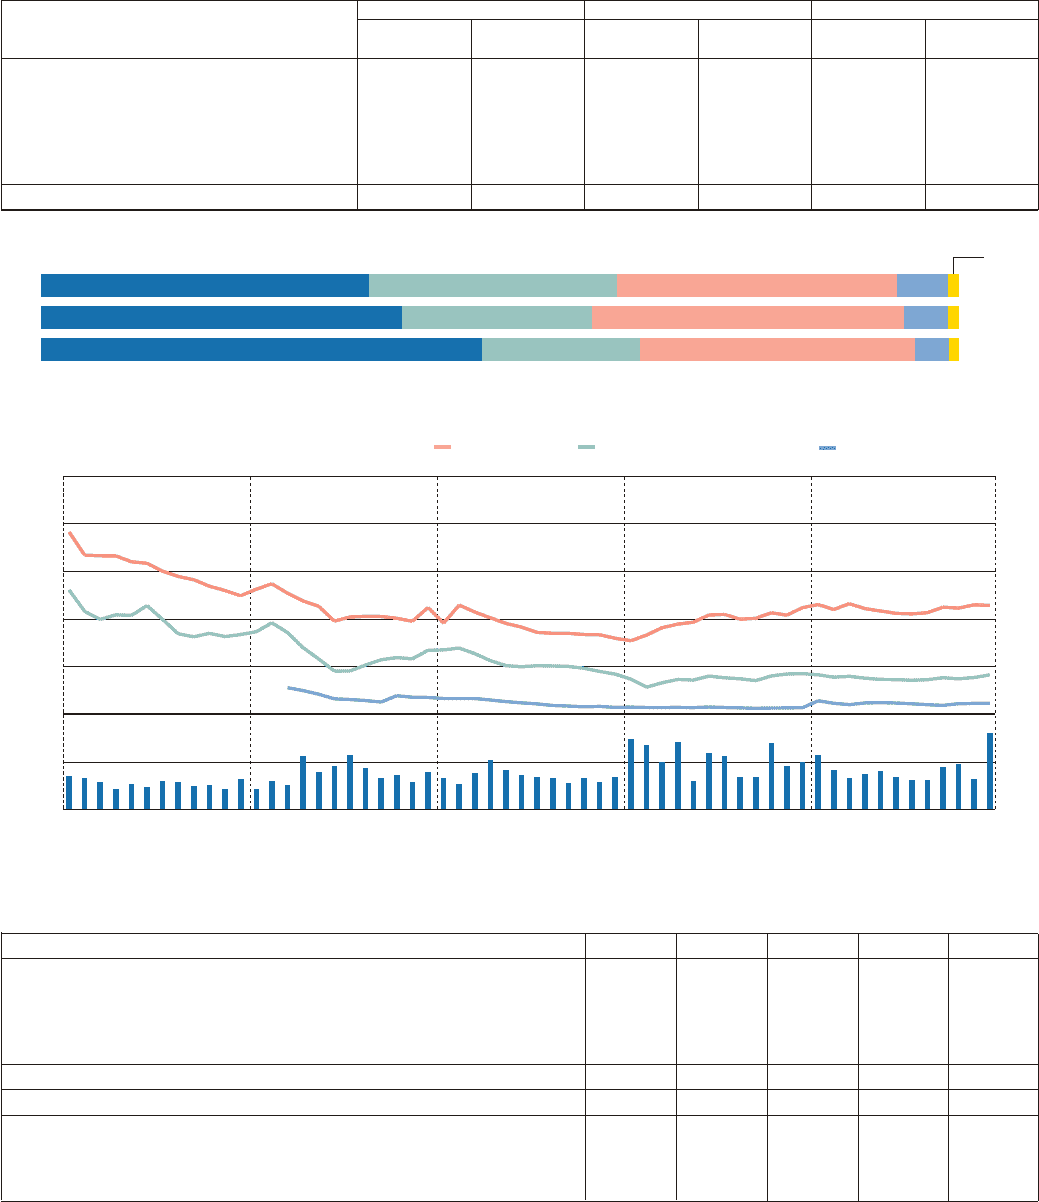
Stock Information
Ownership and Distribution of Shares
2003 2004 2005
Number of Number of Number of Number of Number of Number of
Years ended March 31 shares held shareholders shares held shareholders shares held shareholders
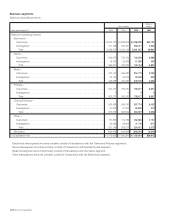
Foreign institutions and individuals . . . . . . . . .
331,477,756 1,660 366,289,954 1,444 480,990,694 1,409
Japanese financial institutions . . . . . . . . . . . .
249,934,658 446 192,651,120 386 172,413,987 350
Japanese individuals and others . . . . . . . . . .
281,939,398 791,371 316,428,972 823,335 300,072,586 776,192
Other Japanese corporations. . . . . . . . . . . . .
51,973,659 6,017 44,113,525 5,726 37,334,315 5,240
Japanese securities firms . . . . . . . . . . . . . . . .
10,131,705 121 10,006,709 97 9,471,631 72
Total . . . . . . . . . . . . . . . . . . . . . . . . . . . . . . .
925,457,176 799,615 929,490,280 830,988 1,000,283,213 783,263
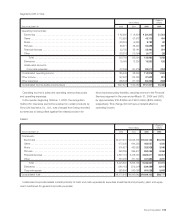
Years ended March 31 2001 2002 2003 2004 2005
Stock price (Yen)
At year-end . . . . . . . . . . . . . . . . . . . . . . . . . . . . . . . . . . . . . . . . . . . . . . . .
8,900 6,700 4,200 4,360 4,270
High . . . . . . . . . . . . . . . . . . . . . . . . . . . . . . . . . . . . . . . . . . . . . . . . . . . . . .
15,100 10,340 7,530 4,670 4,710
Low . . . . . . . . . . . . . . . . . . . . . . . . . . . . . . . . . . . . . . . . . . . . . . . . . . . . . .
7,510 3,960 4,070 2,720 3,550
Annual increase/decrease . . . . . . . . . . . . . . . . . . . . . . . . . . . . . . . . . . . . .
–38.6.%–24.7.%–37.3.%+3.8.%–2.1.%
Number of shares outstanding at year-end (thousands of shares) . . . . . . . . .
919,617 919,744 922,385 926,418 997,211
Market capitalization at year-end (Yen in trillions) . . . . . . . . . . . . . . . . . . . . . .
8.18.6.16.3.87.4.04.4.26.
Per share of common stock data (Yen)
Cash dividends applicable to the year . . . . . . . . . . . . . . . . . . . . . . . . . . . .
25.0.25.0.25.0.25.0.25.0
.
Net Income (diluted) . . . . . . . . . . . . . . . . . . . . . . . . . . . . . . . . . . . . . . . . . .
19.28.16.67.118.21.89.03.162.59
.
Stockholders’ equity . . . . . . . . . . . . . . . . . . . . . . . . . . . . . . . . . . . . . . . . .
2,521.19.2,570.31.2,466.81.2,563.67.2,872.21
.
Note: Stock prices and per share data have been adjusted to reflect the two-for-one stock split completed on May 19, 2000. However, no adjustment to reflect such stock
split has been made to the number of shares outstanding at the year ended March 31, 2000. Stock price data are based on daily closing prices.
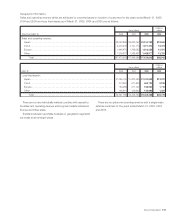
Stock Price Range and Trading Volume on the Tokyo Stock Exchange
Years ended March 31
Japanese individuals and others
Japanese financial institutions
Foreign institutions and individuals
2003
2004
2005
35.8% 27.0% 30.5% 5.6%
48.1% 17.2% 30.0% 3.7%
1.1%
39.4% 20.7% 34.0% 4.8% 1.1%
1.0%
Other Japanese
corporations
Japanese
securities
firms
Notes: 1. This trading volume shows the monthly volume of trade on the Tokyo Stock Exchange. Each fiscal year starts in April and ends in March.
2. Stock prices and the Nikkei stock average is based on a simple average of daily closing prices for each day of every month at the Tokyo Stock Exchange.
3. Stock prices have been adjusted to reflect the two-for-one stock split completed on May 19, 2000.
4. On June 20, 2001, Sony issued 3,072,000 shares of subsidiary tracking stock.
Trading volume
(Million shares)
Stock price and
Nikkei stock average
(Yen)
20022001 2003 2004 2005
25,000
20,000
15,000
10,000
5,000
0
200
100
0
Nikkei stock average Closing price of Sony Corporation stock Subsidiary tracking stock
BH6/30 Adobe PageMaker 6.0J /PPC