Sony 2005 Annual Report Download - page 3
Download and view the complete annual report
Please find page 3 of the 2005 Sony annual report below. You can navigate through the pages in the report by either clicking on the pages listed below, or by using the keyword search tool below to find specific information within the annual report.-
 1
1 -
 2
2 -
 3
3 -
 4
4 -
 5
5 -
 6
6 -
 7
7 -
 8
8 -
 9
9 -
 10
10 -
 11
11 -
 12
12 -
 13
13 -
 14
14 -
15
-
16
-
17
-
18
-
19
-
20
-
21
-
22
-
23
-
24
-
25
-
26
-
27
-
28
-
29
-
30
-
31
-
32
-
33
-
34
-
35
-
36
-
37
-
38
-
39
-
40
-
41
-
42
-
43
-
44
-
45
-
46
-
47
-
48
-
49
-
50
-
51
-
52
-
53
-
54
-
55
-
56
-
57
-
58
-
59
-
60
-
61
-
62
-
63
-
64
-
65
-
66
-
67
-
68
-
69
-
70
-
71
-
72
-
73
-
74
-
75
-
76
-
77
-
78
-
79
-
80
-
81
-
82
-
83
-
84
-
85
-
86
-
87
-
88
-
89
-
90
-
91
-
92
-
93
-
94
-
95
-
96
-
97
-
98
-
99
-
100
-
101
-
102
-
103
-
104
-
105
-
106
-
107
-
108
-
109
-
110
-
111
-
112
-
113
-
114
-
115
-
116
-
117
-
118
-
119
-
120
-
121
-
122
-
123
-
124
-
125
-
126
-
127
-
128
-
129
-
130
-
131
-
132
-
133
-
134
-
135
-
136
-
137
 |
 |
Sony Corporation 1
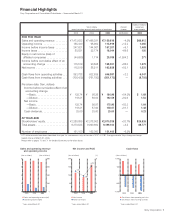
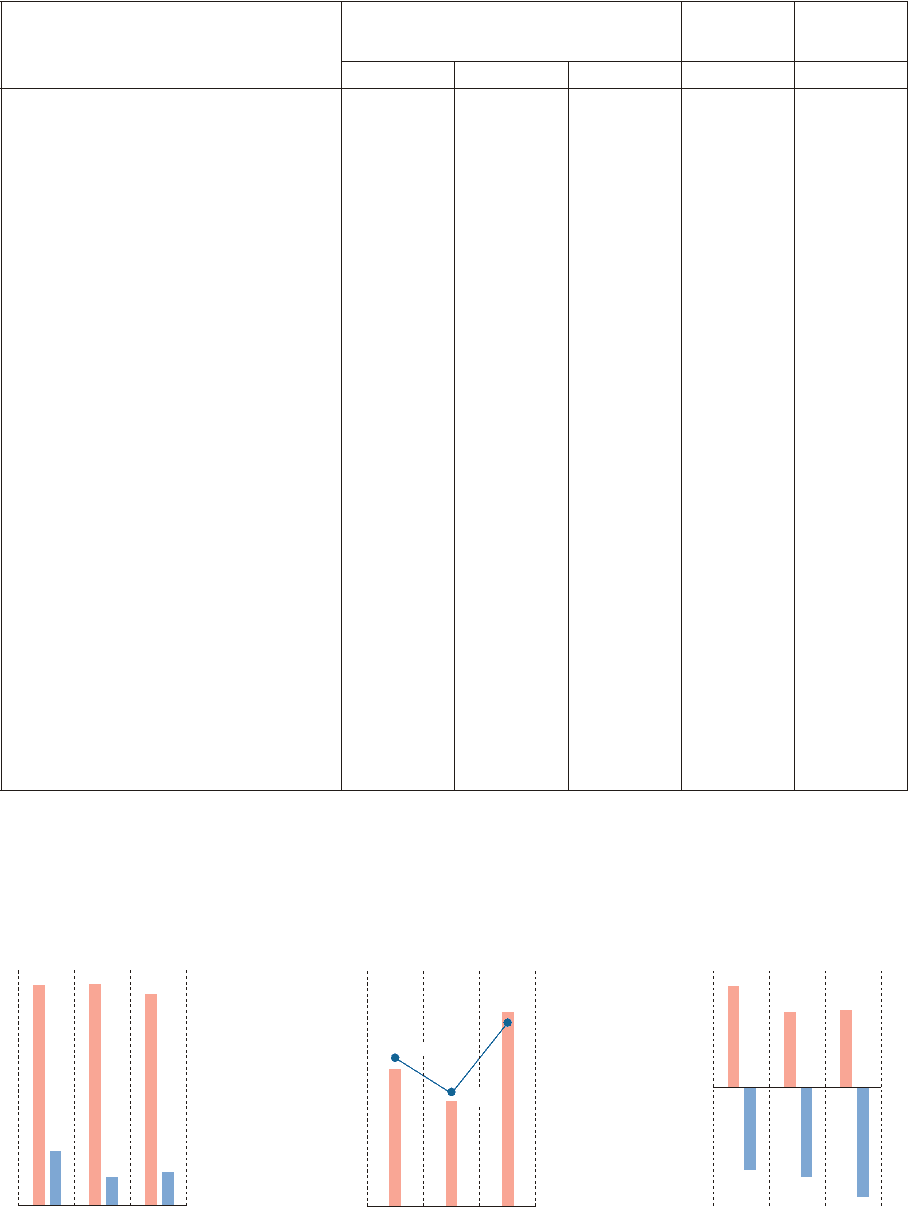
Financial Highlights
Sony Corporation and Consolidated Subsidiaries—Years ended March 31
Sales and operating revenue
and operating income
■ Sales and operating revenue (left)
■ Operating income (right)
*Years ended March 31
(Yen in trillions) (Yen in billions)
8
6
4
2
0
800
600
400
200
0
2003 2004 2005
8
6
4
2
0
200
150
100
50
02003 2004 2005
5.0%
3.8%
6.2%
Net income and ROE
■ Net income
● Return on equity
*Years ended March 31
(Yen in billions) (%)
Cash flows
■ Cash flows from operating activities
■ Cash flows from investing activities
*Years ended March 31
1,000
500
0
–500
–1,000 2003 2004 2005
(Yen in billions)
Dollars in millions*
Yen in millions Percent except per
except per share amounts and number of employees change share amounts
2003 2004 2005 2005/2004 2005
FOR THE YEAR
Sales and operating revenue . . . . . . . .
¥7,473,633 ¥7,496,391 ¥7,159,616 –4.5% $66,912
Operating income . . . . . . . . . . . . . . . .
185,440 98,902 113,919 +15.2 1,065
Income before income taxes . . . . . . . .
247,621 144,067 157,207 +9.1 1,469
Income taxes . . . . . . . . . . . . . . . . . . . .
80,831 52,774 16,044 –69.6 150
Equity in net income (loss) of
affiliated companies . . . . . . . . . . . . . .
(44,690) 1,714 29,039 +1,594.2 271
Income before cumulative effect of an
accounting change . . . . . . . . . . . . . .
115,519 90,628 168,551 +86.0 1,575
Net income . . . . . . . . . . . . . . . . . . . . .
115,519 88,511 163,838 +85.1 1,531
Cash flows from operating activities . . .
853,788 632,635 646,997 +2.3 6,047
Cash flows from investing activities . . .
(706,425) (761,792) (931,172) —(8,703)
Per share data: (Yen, dollars)
Income before cumulative effect of an
accounting change
—Basic . . . . . . . . . . . . . . . . . . . . .
¥ 125.74.¥ 98.26.¥ 180.96.+84.2% $ 1.69.
—Diluted . . . . . . . . . . . . . . . . . . . .
118.21.89.03.162.59.+82.6 1.52.
Net income
—Basic . . . . . . . . . . . . . . . . . . . . .
125.74.95.97.175.90.+83.3 1.64.
—Diluted . . . . . . . . . . . . . . . . . . . .
118.21.87.00.158.07.+81.7 1.48.
Cash dividends . . . . . . . . . . . . . . . . .
25.00.25.00.25.00.
—
0.23.
AT YEAR-END
Stockholders’ equity . . . . . . . . . . . . . . .
¥2,280,895 ¥2,378,002 ¥2,870,338 +20.7% $26,826
Total assets . . . . . . . . . . . . . . . . . . . . .
8,370,545 9,090,662 9,499,100 +4.5 88,777
Number of employees . . . . . . . . . . . . .
161,100 162,000 151,400 –6.5%
* U.S. dollar amounts have been translated from yen, for convenience only, at the rate of ¥107=U.S.$1, the approximate Tokyo foreign exchange
market rate as of March 31, 2005.
Please refer to pages 70 and 71 for detailed footnotes to the table above.
S ONY AR -E 0629 Adobe PageMaker 6.0J /PPC