Sony 2005 Annual Report Download - page 60
Download and view the complete annual report
Please find page 60 of the 2005 Sony annual report below. You can navigate through the pages in the report by either clicking on the pages listed below, or by using the keyword search tool below to find specific information within the annual report.-
 1
1 -
2
-
3
-
4
-
5
-
6
-
7
-
8
-
9
-
10
-
11
-
12
-
13
-
14
-
15
-
16
-
17
-
18
-
19
-
20
-
21
-
22
-
23
-
24
-
25
-
26
-
27
-
28
-
29
-
30
-
31
-
32
-
33
-
34
-
35
-
36
-
37
-
38
-
39
-
40
-
41
-
42
-
43
-
44
-
45
-
46
-
47
-
48
-
49
-
 50
50 -
 51
51 -
 52
52 -
 53
53 -
 54
54 -
 55
55 -
 56
56 -
 57
57 -
 58
58 -
 59
59 -
 60
60 -
 61
61 -
 62
62 -
 63
63 -
 64
64 -
 65
65 -
 66
66 -
 67
67 -
 68
68 -
 69
69 -
 70
70 -
71
-
72
-
73
-
74
-
75
-
76
-
77
-
78
-
79
-
80
-
81
-
82
-
83
-
84
-
85
-
86
-
87
-
88
-
89
-
90
-
91
-
92
-
93
-
94
-
95
-
96
-
97
-
98
-
99
-
100
-
101
-
102
-
103
-
104
-
105
-
106
-
107
-
108
-
109
-
110
-
111
-
112
-
113
-
114
-
115
-
116
-
117
-
118
-
119
-
120
-
121
-
122
-
123
-
124
-
125
-
126
-
127
-
128
-
129
-
130
-
131
-
132
-
133
-
134
-
135
-
136
-
137
 |
 |

Sony Corporation 57
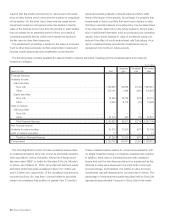
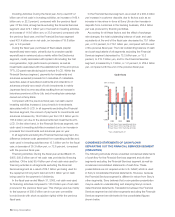
CONDENSED STATEMENTS OF CASH FLOWS SEPARATING OUT THE FINANCIAL SERVICES SEGMENT
Yen in millions
Sony without
Financial Services Financial Services Consolidated
Years ended March 31 2004 2005 2004 2005 2004 2005
Net cash provided by operating activities . . . . . . . . . . . . . . . . . . .
241,627 168,078 401,090 485,439 632,635 646,997
Net cash used in investing activities . . . . . . . . . . . . . . . . . . . . . . .
(401,550) (421,384) (352,496) (472,119) (761,792) (931,172)
Net cash provided by (used in) financing activities . . . . . . . . . . . .
141,696 256,361 153,759 (95,373) 313,283 205,177
Effect of exchange rate changes on cash and cash equivalents . .
——(47,973) 8,890 (47,973) 8,890
Net increase (decrease) in cash and cash equivalents . . . . . . . . .
(18,227) 3,055 154,380 (73,163) 136,153 (70,108)
Cash and cash equivalents at beginning of the fiscal year . . . . . .
274,543 256,316 438,515 592,895 713,058 849,211
Cash and cash equivalents at end of the fiscal year . . . . . . . . . . .
256,316 259,371 592,895 519,732 849,211 779,103
LIQUIDITY AND CAPITAL RESOURCES
Sony’s financial policy is to secure adequate liquidity and
financing for its operations and to maintain the strength of its
balance sheet.
Sony intends to continue both structural reform and invest-
ment for future growth in several segments. Sony believes that it
can maintain sufficient liquidity and financial flexibility to satisfy its
various capital needs, including the funding requirements that
arise from this business strategy, working capital needs, repay-
ment of existing debt, payment of dividend and all its other
capital needs, through operating cash flows and cash and cash
equivalents, its ability to procure necessary funds from the
financial and capital markets, its commitment lines with banks,
and other means.
MARKET ACCESS
Sony Corporation and SGTS, a finance subsidiary in the U.K.,
procure funds from the financial and capital markets.
In order to meet long-term funding requirements, Sony
Corporation utilizes its access to global equity and bond
markets and did not issue any stock or bonds during the fiscal
year. Sony has a shelf registration of 300 billion yen in the
Japanese domestic bond market, of which no bonds were
issued as of March 31, 2005.
In order to meet the working capital requirements of Sony,
SGTS maintains commercial paper (“CP”) programs and a
medium-term note (“MTN”) program. SGTS maintains CP
programs for the U.S., Euro and Japanese CP markets. As of
March 31, 2005, the total amount of these CP programs was
1,251.5 billion yen. During the fiscal year ended March 31,
2005, the largest month-end outstanding balance of CP at
SGTS was 122.5 billion yen in November 2004. There was no
outstanding balance of CP as of March 31, 2005.
SGTS maintains a Euro MTN program of whose total program
amount as of March 31, 2005 was 536.8 billion yen. There was
no outstanding balance as of March 31, 2005. Sony Capital
Corporation (“SCC”), a Sony finance subsidiary in the U.S., had
an outstanding MTN balance of approximately 58.8 billion yen
as of March 31, 2005. However, Sony does not intend to utilize
SCC’s program for future financing requirements as SCC’s
financing function was integrated into that of SGTS.
LIQUIDITY MANAGEMENT
Sony defines its liquidity sources as the amount of cash, cash
equivalents (“cash balance”), and committed lines of credit
contracted with financial institutions. Working capital needs of
Sony shows general seasonality to grow significantly in the third
quarter (from October to December). In Sony’s liquidity manage-
ment, it is basic policy to secure sufficient liquidity throughout
the relevant fiscal year, covering such factors as short-term cash
flow volatility mentioned above, repayments for debts whose
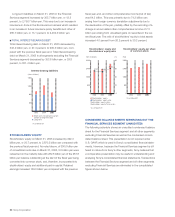
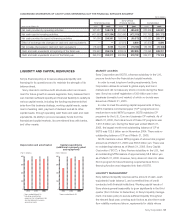
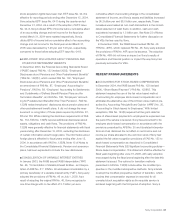
(Yen in billions)
Depreciation and amortization
*Years ended March 31
*Including amortization
expenses for intangible assets
and for deferred insurance
acquisition costs
400
300
200
100
02003 2004 2005
Capital expenditures
(additions to property, plant
and equipment)
*Years ended March 31
(Yen in billions)
400
300
200
100
02003 2004 2005
BH6/30 Adobe PageMaker 6.0J /PPC