Sony 2005 Annual Report Download - page 5
Download and view the complete annual report
Please find page 5 of the 2005 Sony annual report below. You can navigate through the pages in the report by either clicking on the pages listed below, or by using the keyword search tool below to find specific information within the annual report.-
 1
1 -
 2
2 -
 3
3 -
 4
4 -
 5
5 -
 6
6 -
 7
7 -
 8
8 -
 9
9 -
 10
10 -
 11
11 -
 12
12 -
 13
13 -
 14
14 -
 15
15 -
 16
16 -
17
-
18
-
19
-
20
-
21
-
22
-
23
-
24
-
25
-
26
-
27
-
28
-
29
-
30
-
31
-
32
-
33
-
34
-
35
-
36
-
37
-
38
-
39
-
40
-
41
-
42
-
43
-
44
-
45
-
46
-
47
-
48
-
49
-
50
-
51
-
52
-
53
-
54
-
55
-
56
-
57
-
58
-
59
-
60
-
61
-
62
-
63
-
64
-
65
-
66
-
67
-
68
-
69
-
70
-
71
-
72
-
73
-
74
-
75
-
76
-
77
-
78
-
79
-
80
-
81
-
82
-
83
-
84
-
85
-
86
-
87
-
88
-
89
-
90
-
91
-
92
-
93
-
94
-
95
-
96
-
97
-
98
-
99
-
100
-
101
-
102
-
103
-
104
-
105
-
106
-
107
-
108
-
109
-
110
-
111
-
112
-
113
-
114
-
115
-
116
-
117
-
118
-
119
-
120
-
121
-
122
-
123
-
124
-
125
-
126
-
127
-
128
-
129
-
130
-
131
-
132
-
133
-
134
-
135
-
136
-
137
 |
 |

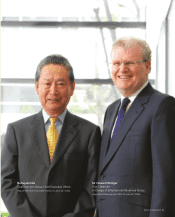
Sony Corporation 3
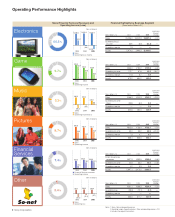
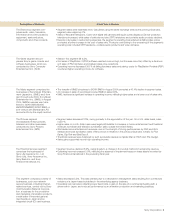
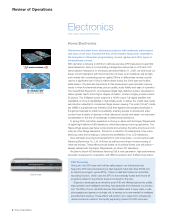
Fiscal Year in ReviewDescription of Business
The Electronics segment com-
prises audio, video, televisions,
information and communications
equipment, semiconductors,
components and other products.
• Segment sales were essentially level. Calculated using the same exchange rates as the previous fiscal year,
segment sales edged up 1%.
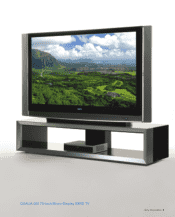
•Sales of flat panel televisions, Cyber-shot digital still cameras and liquid crystal display (LCD) rear-projection
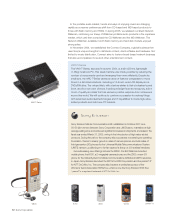
televisions increased, while sales of cathode-ray tube (CRT) televisions and portable audio products declined.
•Despite a decrease in restructuring expenses, the segment’s operating loss widened as falling sales prices
prompted a further increase in the cost of sales ratio. Products contributing to the worsening of the segment’s
operating loss included CRT televisions, portable audio products and video cameras.
•Sales in this segment fell 6.5%.
• Unit sales of PlayStation 2 (PS2) software reached a record high, but this was more than offset by a decline in
unit sales of PS2 hardware and strategic sales price reductions.
• Operating income decreased 36.1% as falling hardware sales and startup costs for PlayStation Portable (PSP)
countered higher operating income for software.
• The transfer of SMEI’s business to SONY BMG in August 2004 prompted a 43.4% decline in segment sales.
•An increase in sales of recordings boosted SMEJ’s sales 6.9%.
•SMEJ achieved a significant increase in operating income, reflecting higher sales and a lower cost of sales ratio.
• Segment sales decreased 3.0%, owing primarily to the appreciation of the yen. On a U.S. dollar basis, sales
rose 1%.
•Higher sales on a U.S. dollar basis were largely attributable to increases in home entertainment and theatrical
revenues worldwide and television syndication sales outside the United States.
•Worldwide home entertainment revenues rose on the strength of strong performances by DVD and VHS
releases and brisk syndication sales of films shown in theaters in the previous fiscal year, notably 50 First
Dates, Big Fish and Bad Boys II.
•Theatrical revenues were bolstered by such successful releases as Spider-Man 2, Hitch and The Grudge.
•Sales gains supported record-high operating income.
• Segment revenue declined 5.6%, owing largely to a change in Sony Life’s method of recognizing revenue.
• Operating income increased 0.6%, reflecting the absence of impairment losses on lease assets recorded by
Sony Finance International in the preceding fiscal year.
• Sales decreased 5.2%. This was primarily due to a decrease in intersegment sales resulting from contractual
revisions at a Japan-based subsidiary in the advertising agency business.
• Operating loss narrowed, reflecting lower fixed costs, a gain on the sale of a commercial building with a
showroom in Japan, and a robust performance by an animation production and marketing business.
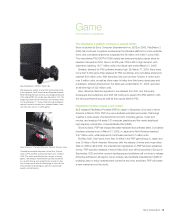
The Game segment encom-
passes Sony’s game console and
software businesses, which are
conducted by Sony Computer
Entertainment Inc. (SCE).
The Music segment comprises the
businesses of Sony Music Entertain-
ment (Japan) Inc. (SMEJ) and, from
April through July 2004, Sony Music
Entertainment Inc. (SMEI). In August
2004, SMEI’s business was trans-
ferred to SONY BMG MUSIC
ENTERTAINMENT (SONY BMG), a
joint venture with Bertelsmann AG
accounted for by the equity method.
The Pictures segment
encompasses motion pictures,
television and other businesses
conducted by Sony Pictures
Entertainment Inc. (SPE).
The Financial Services segment
comprises the businesses of
Sony Life Insurance Co., Ltd.
(Sony Life), Sony Assurance Inc.,
Sony Bank Inc. and Sony
Finance International, Inc.
This segment comprises a variety of
businesses, such as a network
service business, including Internet-
related services, carried out by Sony
Communication Network Corpora-
tion, a business for the production
and marketing of animation products,
a retail seller of imported general
merchandise in Japan and an
integrated circuit (IC) card business.
S ONY AR -E 0629 Adobe PageMaker 6.0J /PPC