Sony 2005 Annual Report Download - page 48
Download and view the complete annual report
Please find page 48 of the 2005 Sony annual report below. You can navigate through the pages in the report by either clicking on the pages listed below, or by using the keyword search tool below to find specific information within the annual report.-
 1
1 -
2
-
3
-
4
-
5
-
6
-
7
-
8
-
9
-
10
-
11
-
12
-
13
-
14
-
15
-
16
-
17
-
18
-
19
-
20
-
21
-
22
-
23
-
24
-
25
-
26
-
27
-
28
-
29
-
30
-
31
-
32
-
33
-
34
-
35
-
36
-
37
-
 38
38 -
 39
39 -
 40
40 -
 41
41 -
 42
42 -
 43
43 -
 44
44 -
 45
45 -
 46
46 -
 47
47 -
 48
48 -
 49
49 -
 50
50 -
 51
51 -
 52
52 -
 53
53 -
 54
54 -
 55
55 -
 56
56 -
 57
57 -
 58
58 -
59
-
60
-
61
-
62
-
63
-
64
-
65
-
66
-
67
-
68
-
69
-
70
-
71
-
72
-
73
-
74
-
75
-
76
-
77
-
78
-
79
-
80
-
81
-
82
-
83
-
84
-
85
-
86
-
87
-
88
-
89
-
90
-
91
-
92
-
93
-
94
-
95
-
96
-
97
-
98
-
99
-
100
-
101
-
102
-
103
-
104
-
105
-
106
-
107
-
108
-
109
-
110
-
111
-
112
-
113
-
114
-
115
-
116
-
117
-
118
-
119
-
120
-
121
-
122
-
123
-
124
-
125
-
126
-
127
-
128
-
129
-
130
-
131
-
132
-
133
-
134
-
135
-
136
-
137
 |
 |

Sony Corporation 45
SPE was approximately 1.3 billion U.S. dollars. SPE expects to
record this amount in the future having entered into contracts
with television broadcasters to provide those broadcasters with
completed motion picture and television product. The license
fee revenue will be recognized in the fiscal year that the product
is available for broadcast.
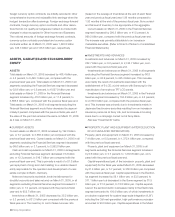
■FINANCIAL SERVICES
Please note that the revenue and operating income at Sony Life,
Sony Assurance Inc. (“Sony Assurance”) and Sony Bank Inc.
(“Sony Bank”) discussed below differ from the results that Sony
Life, Sony Assurance and Sony Bank disclose on a Japanese
statutory basis.
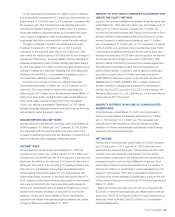
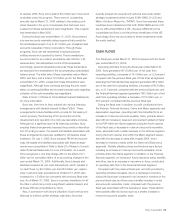
Financial Services revenue for the fiscal year ended March 31,
2005 decreased by 33.0 billion yen, or 5.6 percent, to 560.6
billion yen compared with the previous fiscal year. Operating
income increased by 0.3 billion yen, or 0.6 percent, to 55.5
billion yen and the operating income margin increased to
9.9 percent compared with the 9.3 percent of the previous
fiscal year.
At Sony Life, revenue decreased by 38.7 billion yen, or
7.5 percent, to 474.3 billion yen compared with the previous
fiscal year. The main reasons for the decrease in revenue were
a change in the method of recognizing insurance premiums
received on certain products, as of the third quarter beginning
October 1, 2003, from being recorded as revenues to being
offset against the related provision for future insurance policy
benefits, coupled with a small decrease in valuation gains in the
current fiscal year compared to the previous fiscal year in which
significant valuation gains were recorded against stock conver-
sion rights from convertible bonds. Although there was a
decrease in insurance premium revenue as a result of the above
mentioned change in accounting method, there were increases
in insurance-in-force at the end of the fiscal year compared to
the end of the previous fiscal year. Operating income at Sony
Life decreased by 2.2 billion yen or 3.4 percent to 61.0 billion
yen, mainly due to a decrease in valuation gains against stock
conversion rights from convertible bonds, although this was
partially offset by an increase in revenue from insurance premi-
ums excluding the effect of the change in revenue recognition
method noted above. In addition, the impact on operating
income from the change in revenue recognition method noted
above was slight.
At Sony Assurance, revenue increased due to higher insurance
revenue brought about by an expansion in automobile insurance-
in-force. Operating income increased due to an increase in
insurance revenue, although there was a deterioration in the loss
ratio (the ratio of insurance payouts to premiums).
At Sony Bank, which started operations in June 2001,
revenue rose as there was an increase in interest revenue
associated with an increase in the balance of funds from
investing activities. Although revenue increased, an increase in
operating expenses resulted in a relatively unchanged operating
loss compared with the previous fiscal year.
At Sony Finance International, Inc. (“Sony Finance”), a leasing
and credit financing business subsidiary in Japan, revenue
decreased due to a fall in leasing revenue. In terms of profitabil-
ity, the operating loss decreased due to the recording of a loss,
in the previous fiscal year ended March 31, 2004, from the lease
of certain fixed assets to Crosswave Communications Inc.
(“CWC”), which commenced reorganization proceedings under
the Corporate Reorganization Law of Japan during the same
fiscal year.
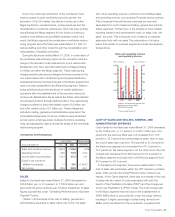
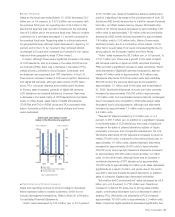
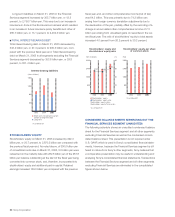
Sales and operating income in
the Pictures segment
■ Sales (left)
■ Operating income (right)
● Operating margin
*Years ended March 31
800
600
400
200
0
80
60
40
20
0
2003 2004 2005
7.3%
8.7%
4.7%
(Yen in billions) (Yen in billions)
(Billions of yen) (Billions of yen)
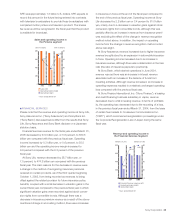
Revenue and operating income in
the Financial Services Segment
■ Financial Services revenue (left)
■ Operating income (right)
● Operating margin
*Years ended March 31
800
600
400
200
0
80
60
40
20
0
2003 2004 2005
4.2%
9.3%
9.9%
BH6/30 Adobe PageMaker 6.0J /PPC