Sony 2005 Annual Report Download - page 43
Download and view the complete annual report
Please find page 43 of the 2005 Sony annual report below. You can navigate through the pages in the report by either clicking on the pages listed below, or by using the keyword search tool below to find specific information within the annual report.-
 1
1 -
2
-
3
-
4
-
5
-
6
-
7
-
8
-
9
-
10
-
11
-
12
-
13
-
14
-
15
-
16
-
17
-
18
-
19
-
20
-
21
-
22
-
23
-
24
-
25
-
26
-
27
-
28
-
29
-
30
-
31
-
32
-
 33
33 -
 34
34 -
 35
35 -
 36
36 -
 37
37 -
 38
38 -
 39
39 -
 40
40 -
 41
41 -
 42
42 -
 43
43 -
 44
44 -
 45
45 -
 46
46 -
 47
47 -
 48
48 -
 49
49 -
 50
50 -
 51
51 -
 52
52 -
 53
53 -
54
-
55
-
56
-
57
-
58
-
59
-
60
-
61
-
62
-
63
-
64
-
65
-
66
-
67
-
68
-
69
-
70
-
71
-
72
-
73
-
74
-
75
-
76
-
77
-
78
-
79
-
80
-
81
-
82
-
83
-
84
-
85
-
86
-
87
-
88
-
89
-
90
-
91
-
92
-
93
-
94
-
95
-
96
-
97
-
98
-
99
-
100
-
101
-
102
-
103
-
104
-
105
-
106
-
107
-
108
-
109
-
110
-
111
-
112
-
113
-
114
-
115
-
116
-
117
-
118
-
119
-
120
-
121
-
122
-
123
-
124
-
125
-
126
-
127
-
128
-
129
-
130
-
131
-
132
-
133
-
134
-
135
-
136
-
137
 |
 |

40 Sony Corporation
company, SONY BMG, is 50 percent owned by each parent
company. Under U.S. GAAP, SONY BMG is accounted for by
Sony using the equity method and, since August 1, 2004, 50
percent of net profits or losses of this business have been
included under equity in net income (loss) of affiliated companies.
In connection with the establishment of this joint venture,
Sony’s non-Japan based disc manufacturing and physical
distribution businesses, formerly included within the Music
segment, have been reclassified to the Electronics segment to
reflect the new management reporting structure whereby Sony’s
Electronics segment has now assumed responsibility for these
businesses. Results for the previous fiscal year in the Electronics
and Music segments have been restated to account for this
reclassification.
In the Music segment, results for the fiscal year ended March
31, 2005 only include the results of Sony Music Entertainment
Inc.’s (“SMEI”) recorded music business for the months of April
through July 2004, and the twelve months results of SMEI’s
music publishing business and SMEJ. However, results for the
previous fiscal year in the Music segment include the consoli-
dated results for SMEI’s recorded music business for all twelve
months of the fiscal year, as well as the full year’s results for
SMEI’s music publishing business and SMEJ.
In July 2004, in order to establish a more efficient and coordi-
nated semiconductor supply structure, Sony completed the
integration of its semiconductor manufacturing business by
transferring Sony Computer Entertainment Inc.’s semiconductor
manufacturing operation from the Game segment to the
Electronics segment. As a result of this transfer, sales revenue
and expenditures associated with this operation are now
recorded within the “Semiconductor” category in the Electronics
segment. The results for the same period of the previous fiscal
year have not been restated as such comparable figures cannot
be practically obtained given that it was not operated as a
separate business within the Game segment. This integration of
the semiconductor manufacturing businesses is a part of Sony’s
semiconductor strategy of utilizing semiconductor technologies
and manufacturing equipment originally developed or designed
for the Game business within Sony as a whole.
OPERATING PERFORMANCE BY BUSINESS SEGMENT
The following discussion is based on segment information.
Sales and operating revenue in each business segment include
intersegment transactions. Refer to Note 25 of Notes to
Consolidated Financial Statements.
BUSINESS SEGMENT INFORMATION
Yen in billions Percent change
Years ended March 31 2004 2005 2005/2004
Sales and operating revenue
Electronics . . . . . . . . . . . .
5,042.3 5,021.6 –0.4%
Game . . . . . . . . . . . . . . . .
780.2 729.8 –6.5%
Music . . . . . . . . . . . . . . . .
440.3 249.1 –43.4%
Pictures . . . . . . . . . . . . . .
756.4 733.7 –3.0%
Financial Services . . . . . . .
593.5 560.6 –5.6%
Other . . . . . . . . . . . . . . . .
268.3 254.4 –5.2%
Elimination . . . . . . . . . . . .
(384.7) (389.6) —%
Consolidated . . . . . . . . . . . .
7,496.4 7,159.6 –4.5%
Operating income (loss)
Electronics . . . . . . . . . . . .
(6.8) (34.3) —%
Game . . . . . . . . . . . . . . . .
67.6 43.2 –36.1%
Music . . . . . . . . . . . . . . . .
(6.0) 8.8 —%
Pictures . . . . . . . . . . . . . .
35.2 63.9 +81.4%
Financial Services . . . . . . .
55.2 55.5 +0.6%
Other . . . . . . . . . . . . . . . .
(12.1) (4.1) —%
Total . . . . . . . . . . . . . . . . . . .
133.1 133.0 –0.1%
Elimination and unallocated
corporate expenses . . . .
(34.2) (19.0) —%
Consolidated . . . . . . . . . . . .
98.9 113.9 +15.2%
As of August 1, 2004, Sony and Bertelsmann AG combined
their recorded music businesses, excluding Sony’s Japanese
recorded music business, in a joint venture. The newly formed
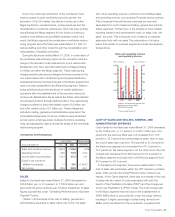
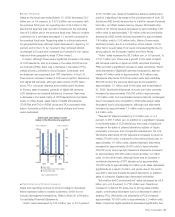
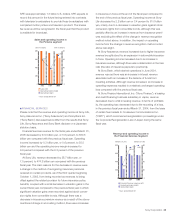
Net income and ROE
■ Net income
● ROE
*Years ended March 31
(Yen in billions) (%) (Yen)
Net income per share of
common stock
■ Basic
■ Diluted
*Years ended March 31
200
150
100
50
02003 2004 2005
8
6
4
2
0
200
150
100
50
02003 2004 2005
5.0%
3.8%
6.2%
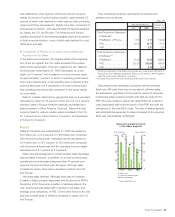
■ Electronics
■ Game
■ Music
■ Pictures
■ Financial Services
■ Other
*Years ended March 31
*Including intersegment transactions
Shares of sales and operating revenue by business segment
9.7% 66.5%
3.3%
9.7%
7.4% 3.4%
BH6/30 Adobe PageMaker 6.0J /PPC