Sony 2005 Annual Report Download - page 81
Download and view the complete annual report
Please find page 81 of the 2005 Sony annual report below. You can navigate through the pages in the report by either clicking on the pages listed below, or by using the keyword search tool below to find specific information within the annual report.-
 1
1 -
2
-
3
-
4
-
5
-
6
-
7
-
8
-
9
-
10
-
11
-
12
-
13
-
14
-
15
-
16
-
17
-
18
-
19
-
20
-
21
-
22
-
23
-
24
-
25
-
26
-
27
-
28
-
29
-
30
-
31
-
32
-
33
-
34
-
35
-
36
-
37
-
38
-
39
-
40
-
41
-
42
-
43
-
44
-
45
-
46
-
47
-
48
-
49
-
50
-
51
-
52
-
53
-
54
-
55
-
56
-
57
-
58
-
59
-
60
-
61
-
62
-
63
-
64
-
65
-
66
-
67
-
68
-
69
-
70
-
 71
71 -
 72
72 -
 73
73 -
 74
74 -
 75
75 -
 76
76 -
 77
77 -
 78
78 -
 79
79 -
 80
80 -
 81
81 -
 82
82 -
 83
83 -
 84
84 -
 85
85 -
 86
86 -
 87
87 -
 88
88 -
 89
89 -
 90
90 -
 91
91 -
92
-
93
-
94
-
95
-
96
-
97
-
98
-
99
-
100
-
101
-
102
-
103
-
104
-
105
-
106
-
107
-
108
-
109
-
110
-
111
-
112
-
113
-
114
-
115
-
116
-
117
-
118
-
119
-
120
-
121
-
122
-
123
-
124
-
125
-
126
-
127
-
128
-
129
-
130
-
131
-
132
-
133
-
134
-
135
-
136
-
137
 |
 |

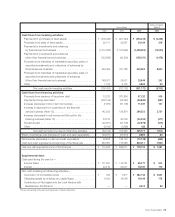
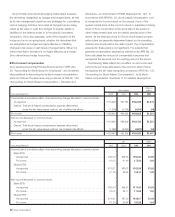
78 Sony Corporation
Consolidated Statements of Cash Flows
Sony Corporation and Consolidated Subsidiaries—Years ended March 31
Dollars in millions
Yen in millions (Note 3)
2003 2004 2005 2005
Cash flows from operating activities:
Net income . . . . . . . . . . . . . . . . . . . . . . . . . . . . . . . . . . . . . . . . .
¥115,519 ¥088,511 ¥163,838 $1,531
Adjustments to reconcile net income to net cash provided
by operating activities—
Depreciation and amortization, including amortization of
deferred insurance acquisition costs . . . . . . . . . . . . . . . . . . .
351,925 366,269 372,865 3,485
Amortization of film costs . . . . . . . . . . . . . . . . . . . . . . . . . . . .
312,054 305,786 276,320 2,582
Accrual for pension and severance costs, less payments . . . .
37,858 35,562 22,837 214
Loss on sale, disposal or impairment of assets, net
(Notes 10 and 18) . . . . . . . . . . . . . . . . . . . . . . . . . . . . . . . . .
39,941 35,495 27,994 261
Gain on sale or loss on devaluation of securities investments,
net (Notes 6 and 8) . . . . . . . . . . . . . . . . . . . . . . . . . . . . . . . .
(49,354) 4,707 (1,722) (16)
Gain on change in interest in subsidiaries and equity
investees (Note 20) . . . . . . . . . . . . . . . . . . . . . . . . . . . . . . . .
—(4,870) (16,322) (153)
Deferred income taxes (Note 21) . . . . . . . . . . . . . . . . . . . . . . .
(98,016) (34,445) (69,466) (649)
Equity in net (income) losses of affiliated companies,
net of dividends. . . . . . . . . . . . . . . . . . . . . . . . . . . . . . . . . . .
46,692 1,732 (15,648) (146)
Cumulative effect of an accounting change (Note 2) . . . . . . . .
—2,117 4,713 44
Changes in assets and liabilities:
(Increase) decrease in notes and accounts receivable,
trade . . . . . . . . . . . . . . . . . . . . . . . . . . . . . . . . . . . . . . . . .
174,679 (63,010) (22,056) (206)
(Increase) decrease in inventories. . . . . . . . . . . . . . . . . . . . .
36,039 (78,656) 34,128 319
Increase in film costs . . . . . . . . . . . . . . . . . . . . . . . . . . . . . .
(317,953) (299,843) (294,272) (2,750)
Increase (decrease) in notes and accounts payable,
trade . . . . . . . . . . . . . . . . . . . . . . . . . . . . . . . . . . . . . . . . .
(58,384) 93,950 31,473 294
Increase (decrease) in accrued income and other taxes . . . .
14,637 (46,067) 30
Increase in future insurance policy benefits and other . . . . .
233,992 264,216 144,143 1,347
Increase in deferred insurance acquisition costs . . . . . . . . .
(66,091) (71,219) (65,051) (608)
(Increase) decrease in marketable securities held in the
financial service business for trading purpose . . . . . . . . . .
—369 (28,524) (266)
(Increase) decrease in other current assets . . . . . . . . . . . . .
29,095 (34,991) (29,699) (278)
Increase in other current liabilities . . . . . . . . . . . . . . . . . . . . .
26,205 44,772 46,545 435
Other . . . . . . . . . . . . . . . . . . . . . . . . . . . . . . . . . . . . . . . . . .
24,950 22,250 64,898 607
Net cash provided by operating activities . . . . . . . . . . .
¥853,788 ¥632,635 ¥646,997 $6,047
(Continued on following page.)
BH6/30 Adobe PageMaker 6.0J /PPC