Sony 2005 Annual Report Download - page 46
Download and view the complete annual report
Please find page 46 of the 2005 Sony annual report below. You can navigate through the pages in the report by either clicking on the pages listed below, or by using the keyword search tool below to find specific information within the annual report.-
 1
1 -
2
-
3
-
4
-
5
-
6
-
7
-
8
-
9
-
10
-
11
-
12
-
13
-
14
-
15
-
16
-
17
-
18
-
19
-
20
-
21
-
22
-
23
-
24
-
25
-
26
-
27
-
28
-
29
-
30
-
31
-
32
-
33
-
34
-
35
-
 36
36 -
 37
37 -
 38
38 -
 39
39 -
 40
40 -
 41
41 -
 42
42 -
 43
43 -
 44
44 -
 45
45 -
 46
46 -
 47
47 -
 48
48 -
 49
49 -
 50
50 -
 51
51 -
 52
52 -
 53
53 -
 54
54 -
 55
55 -
 56
56 -
57
-
58
-
59
-
60
-
61
-
62
-
63
-
64
-
65
-
66
-
67
-
68
-
69
-
70
-
71
-
72
-
73
-
74
-
75
-
76
-
77
-
78
-
79
-
80
-
81
-
82
-
83
-
84
-
85
-
86
-
87
-
88
-
89
-
90
-
91
-
92
-
93
-
94
-
95
-
96
-
97
-
98
-
99
-
100
-
101
-
102
-
103
-
104
-
105
-
106
-
107
-
108
-
109
-
110
-
111
-
112
-
113
-
114
-
115
-
116
-
117
-
118
-
119
-
120
-
121
-
122
-
123
-
124
-
125
-
126
-
127
-
128
-
129
-
130
-
131
-
132
-
133
-
134
-
135
-
136
-
137
 |
 |

Sony Corporation 43
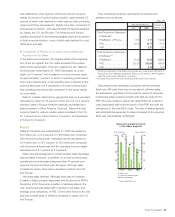
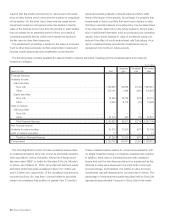
Total worldwide production shipments of hardware and
software were as follows:
Million units
Years ended March 31 Cumulative as of
2004 2005 March 31, 2005
Total Production Shipments
of Hardware*
PlayStation + PS one . . . .
3.31 2.77 102.49
PS2 . . . . . . . . . . . . . . . . .
20.10 16.17 87.47
PSP . . . . . . . . . . . . . . . . .
2.97 2.97
Total Production Shipments
of Software*/**
PlayStation . . . . . . . . . . . .
32.00 10.00 959.00
PS2 . . . . . . . . . . . . . . . . .
222.00 252.00 824.00
PSP . . . . . . . . . . . . . . . . .
5.70 5.70
**Production shipments of hardware and software are counted upon shipment of
the products from manufacturing bases. Sales of such products are recognized
when the products are delivered to customers.
** Including those both from Sony and third parties under Sony licenses.
Operating income decreased compared with the previous
fiscal year. Although there was an increase in software sales,
the decrease in operating income was the result of a decrease
in hardware sales coupled primarily with start up costs for the
PSP. The cost of sales to sales ratio deteriorated as a result of
costs associated with both the launch of the PSP and with the
changeover to the new PS2 model. The ratio of selling, general
and administrative expenses to sales compared to the previous
fiscal year was relatively unchanged.
was destined for other regions. China accounted for approxi-
mately 10 percent of total annual production, approximately 70
percent of which was destined for other regions. Asia, excluding
Japan and China, accounted for slightly more than 10 percent of
total annual production, with approximately 60 percent destined
for Japan, the U.S. and Europe. The Americas and Europe
together accounted for the remaining slightly less than 30 percent
of total annual production, most of which was destined for local
distribution and sale.
●Comparison of Results on a Local Currency Basis and
Results on a Yen Basis
In the Electronics segment, the negative effect of the apprecia-
tion of the yen against the U.S. dollar exceeded the positive
effect of the appreciation of the euro against the yen. Sales for
the fiscal year ended March 31, 2005 decreased, on a yen
basis, by 0.4 percent, but increased on a local currency basis
by approximately 1 percent. In terms of operating performance,
there was a deterioration in the operating loss compared to the
previous fiscal year, but if calculated on a local currency basis,
this operating loss was smaller compared to the actual results
on a yen basis.
Sales to outside customers by geographic area on a yen basis
decreased in Japan by 10 percent, and in the U.S. by 4 percent:
however, sales in Europe remained relatively unchanged and
sales increased in Other Areas by 9 percent. Sales on a local
currency basis for regions outside Japan increased in the U.S.
by 1 percent and in Other Areas by 13 percent, but decreased
in Europe by 2 percent.
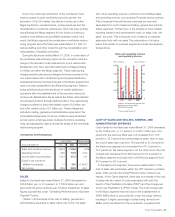
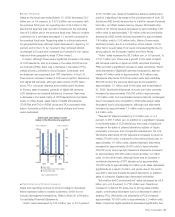
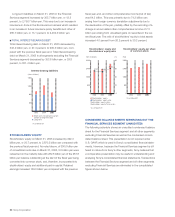
■GAME
Sales for the fiscal year ended March 31, 2005 decreased by
50.5 billion yen, or 6.5 percent, to 729.8 billion yen compared
with the previous fiscal year. Operating income decreased by
24.4 billion yen, or 36.1 percent, to 43.2 billion yen compared
with the previous fiscal year, and the operating income margin
decreased from 8.7 percent to 5.9 percent.
Sales in the Game segment on a local currency basis decreased
approximately 6 percent. In addition, on a local currency basis,
operating income decreased approximately 45 percent com-
pared to the previous fiscal year. By region, although sales
increased in Japan, there was a decrease in sales in the U.S.
and Europe.
Hardware sales declined. Although there was an increase
in sales in Japan primarily associated with the launch of PSP in
December 2004, there was a decline in hardware sales in the
U.S. and Europe associated with a decline in unit sales, and
strategic price reductions, of PS2. On the other hand, both units
sales and overall sales of software increased in Japan, the U.S.
and Europe.
(Yen in billions)
Sales and operating income
in the Game segment
■ Sales (left)
■ Operating income (right)
● Operating margin
*Years ended March 31
1,200
900
600
300
0
240
180
120
60
0
2003 2004 2005
11.8%
8.7%
5.9%
(Yen in billions)
BH6/30 Adobe PageMaker 6.0J /PPC