Sony 2005 Annual Report Download - page 51
Download and view the complete annual report
Please find page 51 of the 2005 Sony annual report below. You can navigate through the pages in the report by either clicking on the pages listed below, or by using the keyword search tool below to find specific information within the annual report.-
 1
1 -
2
-
3
-
4
-
5
-
6
-
7
-
8
-
9
-
10
-
11
-
12
-
13
-
14
-
15
-
16
-
17
-
18
-
19
-
20
-
21
-
22
-
23
-
24
-
25
-
26
-
27
-
28
-
29
-
30
-
31
-
32
-
33
-
34
-
35
-
36
-
37
-
38
-
39
-
40
-
 41
41 -
 42
42 -
 43
43 -
 44
44 -
 45
45 -
 46
46 -
 47
47 -
 48
48 -
 49
49 -
 50
50 -
 51
51 -
 52
52 -
 53
53 -
 54
54 -
 55
55 -
 56
56 -
 57
57 -
 58
58 -
 59
59 -
 60
60 -
 61
61 -
62
-
63
-
64
-
65
-
66
-
67
-
68
-
69
-
70
-
71
-
72
-
73
-
74
-
75
-
76
-
77
-
78
-
79
-
80
-
81
-
82
-
83
-
84
-
85
-
86
-
87
-
88
-
89
-
90
-
91
-
92
-
93
-
94
-
95
-
96
-
97
-
98
-
99
-
100
-
101
-
102
-
103
-
104
-
105
-
106
-
107
-
108
-
109
-
110
-
111
-
112
-
113
-
114
-
115
-
116
-
117
-
118
-
119
-
120
-
121
-
122
-
123
-
124
-
125
-
126
-
127
-
128
-
129
-
130
-
131
-
132
-
133
-
134
-
135
-
136
-
137
 |
 |
48 Sony Corporation
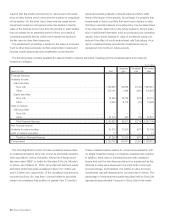
foreign currency option contracts, are initially recorded in other
comprehensive income and reclassified into earnings when the
hedged transaction affects earnings. Foreign exchange forward
contracts, foreign currency option contracts and other deriva-
tives that do not qualify as hedges are marked-to-market with
changes in value recognized in Other Income and Expenses.
The notional amounts of foreign exchange forward contracts,
currency option contracts purchased and currency option
contracts written as of March 31, 2005 were 1,545.8 billion
yen, 428.3 billion yen and 146.5 billion yen, respectively.
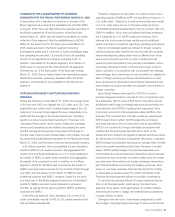
ASSETS, LIABILITIES AND STOCKHOLDERS’
EQUITY
ASSETS
Total assets on March 31, 2005 increased by 408.4 billion yen,
or 4.5 percent, to 9,499.1 billion yen, compared with the
previous fiscal year-end. Total assets on March 31, 2005 in all
segments excluding the Financial Services segment decreased
by 32.9 billion yen, or 0.5 percent, to 6,027.9 billion yen and
total assets on March 31, 2005 in the Financial Services
segment increased by 410.5 billion yen, or 11.8 percent, to
3,885.5 billion yen, compared with the previous fiscal year-end.
Total assets on March 31, 2005 in all segments excluding the
Financial Services segment would have decreased by approxi-
mately 2 percent compared with the previous fiscal year-end if
the value of the yen had remained the same on March 31, 2005
as it was on March 31, 2004.
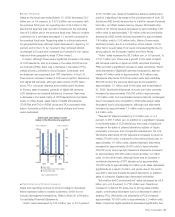
■CURRENT ASSETS
Current assets on March 31, 2005 increased by 192.8 billion
yen, or 5.7 percent, to 3,556.2 billion yen compared with the
previous fiscal year-end. Current assets on March 31, 2005 in all
segments excluding the Financial Services segment decreased
by 99.6 billion yen, or 3.7 percent, to 2,592.8 billion yen.
Cash and cash equivalents on March 31, 2005 in all segments
excluding Financial Services segment decreased 73.2 billion
yen, or 12.3 percent, to 519.7 billion yen compared with the
previous fiscal year-end. This is primarily a result of a 57.3 billion
yen repayment of long-term debt relating to a variable interest
entity responsible for the operation and development of a real
estate complex in Berlin, Germany.
Notes and accounts receivable, trade (net allowance for
doubtful accounts and sales returns) on March 31, 2005, in all
segments excluding Financial Services segment increased 9.1
billion yen, or 1.0 percent, compared with the previous fiscal
year-end to 952.7 billion yen.
Inventories on March 31, 2005 decreased by 35.2 billion yen,
or 5.3 percent, to 631.3 billion yen compared with the previous
fiscal year-end. The inventory to cost of sales turnover ratio
(based on the average of inventories at the end of each fiscal
year and previous fiscal year) was 1.56 months compared to
1.53 months at the end of the previous fiscal year. Sony consid-
ers this level of inventory to be appropriate in the aggregate.
Current assets on March 31, 2005 in the Financial Services
segment increased by 290.5 billion yen, or 41.5 percent, to
990.2 billion yen, compared with the previous fiscal year-end.
The increase was primarily attributable to an increase in
marketable securities. (Refer to Note 8 of Notes to Consolidated
Financial Statements.)
■INVESTMENTS AND ADVANCES
Investments and advances on March 31, 2005 increased by
232.7 billion yen, or 9.3 percent, to 2,745.7 billion yen, com-
pared with the previous fiscal year-end.
Investments and advances on March 31, 2005 in all segments
excluding the Financial Services segment increased by 86.8
billion yen, or 24.2 percent, to 445.4 billion yen. This increase
was mainly the result of investments associated with the
establishment of S-LCD, a joint venture with Samsung for the
manufacture of amorphous TFT LCD panels.
Investments and advances on March 31, 2005 in the Financial
Services segment increased by 104.5 billion yen, or 4.6 percent,
to 2,379.0 billion yen, compared with the previous fiscal year-
end. This increase was primarily due to investments mainly in
Japanese fixed income securities resulting from an increase in
insurance premiums at Sony Life, and an increase in housing
loans due to a campaign carried out at Sony Bank.
Also see “Investments” below.
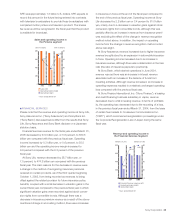
■PROPERTY, PLANT AND EQUIPMENT (AFTER DEDUCTION
OF ACCUMULATED DEPRECIATION)
Property, plant and equipment on March 31, 2005 increased by
7.4 billion yen, or 0.5 percent, to 1,372.4 billion yen, compared
with the previous fiscal year-end.
Property, plant and equipment on March 31, 2005 in all
segments excluding the Financial Services segment increased
by 9.6 billion yen, or 0.7 percent, to 1,333.8 billion yen, com-
pared with the previous fiscal year-end.
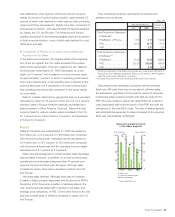
Capital expenditures (part of the increase in property, plant and
equipment) for the fiscal year ended March 31, 2005 decreased
by 21.4 billion yen, or 5.7 percent, to 356.8 billion yen compared
with the previous fiscal year. Capital expenditures in the Electron-
ics segment increased by 59.1 billion yen, or 23.5 percent, to
311.1 billion yen but decreased in the Game segment by 81.5
billion yen, or 81.2 percent, to 18.8 billion yen. Capital expendi-
tures in the semiconductor businesses mainly in the Electronics
segment amounted to 150.0 billion yen, of which investments in
production equipment for system large-scale integration (“LSI”)
including the Cell next-generation, high-performance processor
amounted to 90.0 billion yen. Capital expenditures in the Music
BH6/30 Adobe PageMaker 6.0J /PPC