Sony 2005 Annual Report Download - page 49
Download and view the complete annual report
Please find page 49 of the 2005 Sony annual report below. You can navigate through the pages in the report by either clicking on the pages listed below, or by using the keyword search tool below to find specific information within the annual report.-
 1
1 -
2
-
3
-
4
-
5
-
6
-
7
-
8
-
9
-
10
-
11
-
12
-
13
-
14
-
15
-
16
-
17
-
18
-
19
-
20
-
21
-
22
-
23
-
24
-
25
-
26
-
27
-
28
-
29
-
30
-
31
-
32
-
33
-
34
-
35
-
36
-
37
-
38
-
 39
39 -
 40
40 -
 41
41 -
 42
42 -
 43
43 -
 44
44 -
 45
45 -
 46
46 -
 47
47 -
 48
48 -
 49
49 -
 50
50 -
 51
51 -
 52
52 -
 53
53 -
 54
54 -
 55
55 -
 56
56 -
 57
57 -
 58
58 -
 59
59 -
60
-
61
-
62
-
63
-
64
-
65
-
66
-
67
-
68
-
69
-
70
-
71
-
72
-
73
-
74
-
75
-
76
-
77
-
78
-
79
-
80
-
81
-
82
-
83
-
84
-
85
-
86
-
87
-
88
-
89
-
90
-
91
-
92
-
93
-
94
-
95
-
96
-
97
-
98
-
99
-
100
-
101
-
102
-
103
-
104
-
105
-
106
-
107
-
108
-
109
-
110
-
111
-
112
-
113
-
114
-
115
-
116
-
117
-
118
-
119
-
120
-
121
-
122
-
123
-
124
-
125
-
126
-
127
-
128
-
129
-
130
-
131
-
132
-
133
-
134
-
135
-
136
-
137
 |
 |

46 Sony Corporation
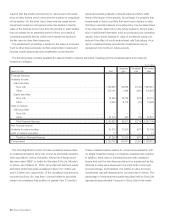
●Condensed Statements of Income Separating Out the
Financial Services Segment (Unaudited)
The following schedule shows unaudited condensed statements
of income for the Financial Services segment and all other
segments excluding Financial Services as well as condensed
consolidated statements of income. This presentation is not
required under U.S. GAAP, which is used in Sony’s consolidated
financial statements. However, because the Financial Services
segment is different in nature from Sony’s other segments, Sony
believes that a comparative presentation may be useful in
understanding and analyzing Sony’s consolidated financial
statements.
Transactions between the Financial Services segment and all
other segments excluding Financial Services are eliminated in
the consolidated figures shown below.
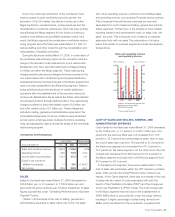
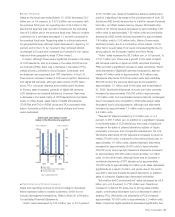
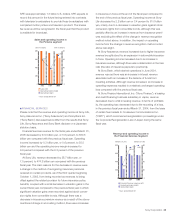
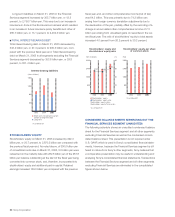
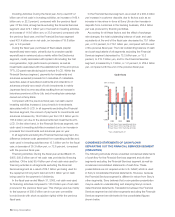
Sales and operating loss
in the Other segment
2003 2004 2005
–4.5%
–1.6%
–10.8%
400
200
0
–200
–400
40
20
0
–20
–40
(Yen in billions) (Yen in billions)
■ Sales (left)
■ Operating loss (right)
● Operating margin
*Years ended March 31
CONDENSED STATEMENTS OF INCOME SEPARATING OUT THE FINANCIAL SERVICES SEGMENT
Yen in millions
Sony without
Financial Services Financial Services Consolidated
Years ended March 31 2004 2005 2004 2005 2004 2005
Financial Services revenue . . . . . . . . . . . . . . . . . . . . . . . . . . . . . .
593,544 560,557 ——565,752 537,715
Net sales and operating revenue . . . . . . . . . . . . . . . . . . . . . . . . .
——6,939,964 6,632,728 6,930,639 6,621,901
. . . . . . . . . . . . . . . . . . . . . . . . . . . . . . . . . . . . . . . . . . . . . . . . . .
593,544 560,557 6,939,964 6,632,728 7,496,391 7,159,616
Costs and expenses . . . . . . . . . . . . . . . . . . . . . . . . . . . . . . . . . .
538,383 505,067 6,896,377 6,575,354 7,397,489 7,045,697
Operating income . . . . . . . . . . . . . . . . . . . . . . . . . . . . . . . . . . . .
55,161 55,490 43,587 57,374 98,902 113,919
Other income (expenses), net . . . . . . . . . . . . . . . . . . . . . . . . . . .
1,958 10,204 52,746 40,639 45,165 43,288
Income before income taxes . . . . . . . . . . . . . . . . . . . . . . . . . . . .
57,119 65,694 96,333 98,013 144,067 157,207
Income taxes and other . . . . . . . . . . . . . . . . . . . . . . . . . . . . . . . .
22,975 25,698 30,916 (37,043) 53,439 (11,344)
Income before cumulative effect of an accounting change . . . . . .
34,144 39,996 65,417 135,056 90,628 168,551
Cumulative effect of an accounting change . . . . . . . . . . . . . . . . .
—(4,713) (2,117) —(2,117) (4,713)
Net income . . . . . . . . . . . . . . . . . . . . . . . . . . . . . . . . . . . . . . . . .
34,144 35,283 63,300 135,056 88,511 163,838
■OTHER
During the fiscal year ended March 31, 2005, sales within the
Other segment were comprised mainly of sales from an adver-
tising agency business in Japan; SCN, an Internet-related
service business subsidiary operating mainly in Japan; an
imported general merchandise retail business; an in-house
oriented facility management business; and from an IC-card
business.
Sales for the fiscal year ended March 31, 2005 decreased by
13.9 billion yen, or 5.2 percent, to 254.4 billion yen, compared
with the previous fiscal year. Of total segment sales, 72 percent
were sales to outside customers. In terms of profit performance,
operating losses for the segment improved for the fiscal year
from 12.1 billion yen to 4.1 billion yen.
During the fiscal year, sales decreased primarily as the result
of a decrease in intersegment sales due to contract changes at
a Japanese subsidiary involved in the advertising agency
business. Regarding profit performance, an operating loss of 4.1
billion yen was recorded, an 8.0 billion yen improvement on the
12.1 billion yen loss recorded in the previous fiscal year. This
improvement was mainly due to a reduction of fixed costs, a
gain from the sale of a retail and showroom building in Japan
and the strong performance of a business engaged in the
production and marketing of animation products. Segment
losses decreased despite the absence in the fiscal year ended
March 31, 2005 of a 7.7 billion yen one-time gain recorded at a
business operated by a U.S. subsidiary on the sale of rights
related to a portion of the Sony Credit Card portfolio in the
previous fiscal year.
BH6/30 Adobe PageMaker 6.0J /PPC