Sony 2005 Annual Report Download - page 47
Download and view the complete annual report
Please find page 47 of the 2005 Sony annual report below. You can navigate through the pages in the report by either clicking on the pages listed below, or by using the keyword search tool below to find specific information within the annual report.-
 1
1 -
2
-
3
-
4
-
5
-
6
-
7
-
8
-
9
-
10
-
11
-
12
-
13
-
14
-
15
-
16
-
17
-
18
-
19
-
20
-
21
-
22
-
23
-
24
-
25
-
26
-
27
-
28
-
29
-
30
-
31
-
32
-
33
-
34
-
35
-
36
-
 37
37 -
 38
38 -
 39
39 -
 40
40 -
 41
41 -
 42
42 -
 43
43 -
 44
44 -
 45
45 -
 46
46 -
 47
47 -
 48
48 -
 49
49 -
 50
50 -
 51
51 -
 52
52 -
 53
53 -
 54
54 -
 55
55 -
 56
56 -
 57
57 -
58
-
59
-
60
-
61
-
62
-
63
-
64
-
65
-
66
-
67
-
68
-
69
-
70
-
71
-
72
-
73
-
74
-
75
-
76
-
77
-
78
-
79
-
80
-
81
-
82
-
83
-
84
-
85
-
86
-
87
-
88
-
89
-
90
-
91
-
92
-
93
-
94
-
95
-
96
-
97
-
98
-
99
-
100
-
101
-
102
-
103
-
104
-
105
-
106
-
107
-
108
-
109
-
110
-
111
-
112
-
113
-
114
-
115
-
116
-
117
-
118
-
119
-
120
-
121
-
122
-
123
-
124
-
125
-
126
-
127
-
128
-
129
-
130
-
131
-
132
-
133
-
134
-
135
-
136
-
137
 |
 |

44 Sony Corporation
■MUSIC
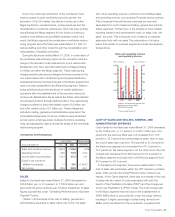
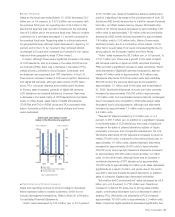
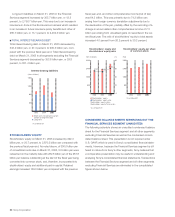
Sales for the fiscal year ended March 31, 2005 decreased by
191.2 billion yen, or 43.4 percent, to 249.1 billion yen compared
with the previous fiscal year. Of the Music segment’s sales,
62 percent were generated by SMEJ, a Japan-based subsidiary,
and 38 percent were generated by SMEI, a U.S.-based
subsidiary. Compared to an operating loss of 6.0 billion yen
in the previous fiscal year, operating income of 8.8 billion yen
was recorded.
On a local currency basis, sales in the Music segment
decreased by approximately 42 percent, although the Music
segment recorded operating income as compared to an
operating loss in the previous fiscal year.
As previously noted, the recorded music business of SMEI
merged with the recorded music business of Bertelsmann AG
to form SONY BMG. As a result, there were no recorded music
sales at SMEI after July 31, 2004. Therefore, SMEI’s results are
not comparable with the results of the previous fiscal year.
Sales at SMEJ increased by 6.9 percent compared with the
previous fiscal year mainly due to an increase in album and
single sales. Best-selling albums and singles during the fiscal
year included musiQ by ORANGE RANGE, SENTIMENTALovers
by Ken Hirai and two greatest hits albums by Porno Graffitti.
Operating income increased by approximately 250 percent
compared to the previous fiscal year due mainly to the higher
sales noted above and an improvement in the cost of sales ratio
associated with strong sales of greatest hits albums.
■PICTURES
Sales for the fiscal year ended March 31, 2005 decreased by
22.7 billion yen, or 3.0 percent, to 733.7 billion yen compared
with the previous fiscal year. Operating income increased by
28.7 billion yen, or 81.4 percent, to 63.9 billion yen and the
operating income margin increased from 4.7 percent to
8.7 percent. The results in the Pictures segment consist of the
results of Sony Pictures Entertainment Inc. (“SPE”), a U.S.
based subsidiary.
On a U.S. dollar basis, sales for the fiscal year in the Pictures
segment increased approximately 1 percent and operating
income increased by approximately 76 percent. Sales increased
primarily due to higher worldwide home entertainment, interna-
tional television syndication and worldwide theatrical revenues
on films. Worldwide home entertainment and international
television syndication revenues were higher as a result of the
performance of films from the prior year release slate including
50 First Dates, Big Fish and Bad Boys 2. For theatrical rev-
enues, the success of the current year film slate, particularly
Spider-Man 2, Hitch and The Grudge, more than offset the
impact of releasing fewer films this fiscal year. Sales for the fiscal
year release slate decreased 70 million U.S. dollars as com-
pared to the previous fiscal year. However, sales in the fiscal
year ended March 31, 2005 from the prior year release slate
increased 304 million U.S. dollars as compared to sales in the
previous fiscal year from the release slate for the fiscal year
ended March 31, 2003. While benefiting from higher theatrical
revenues, total fiscal year release slate revenues were lower due
to the timing of the fiscal year’s film slate’s release in the home
entertainment market. The higher sales from films were partially
offset by a 248 million U.S. dollar decrease in sales resulting
from the absence in the fiscal year ended March 31, 2005 of
several transactions in the television business that occurred in
the prior fiscal year. These included syndication sales of King of
Queens and Seinfeld as well as the extension of a licensing
agreement for Wheel of Fortune. Television sales in the fiscal
year ended March 31, 2005 benefited from the highly successful
DVD release of Seinfeld.
Operating income for the segment increased significantly,
resulting in record operating income for the segment, due to the
strong overall performance of the current year film slate and the
home entertainment and international television syndication
carryover performance of the prior year film slate noted above.
Operating loss from the fiscal year release slate decreased 415
million U.S. dollars and operating income for the prior year’s
release slate increased 173 million U.S. dollars as compared to
the prior year. Spider-Man 2’s worldwide success contributed
substantially to this fiscal year’s earnings, offset somewhat by
the disappointing theatrical performance of Spanglish. Further
improving operating income was a 38 million U.S. dollar decrease
in restructuring charges. Partially offsetting these increases in
operating income was the impact of the absence of the televi-
sion transactions noted above, which reduced operating income
by approximately 150 million U.S. dollars due primarily to the
factors noted above for revenue.
As of March 31, 2005, unrecognized license fee revenue at
Sales and operating income
(loss) in the Music segment
■ Sales (left)
■ Operating income (loss) (right)
● Operating margin
*Years ended March 31
(Yen in billions) (Yen in billions)
2003 2004 2005
–1.4%
3.5%
–6.1%
600
400
200
0
–200
90
60
30
0
–30
BH6/30 Adobe PageMaker 6.0J /PPC