Sony 2005 Annual Report Download - page 79
Download and view the complete annual report
Please find page 79 of the 2005 Sony annual report below. You can navigate through the pages in the report by either clicking on the pages listed below, or by using the keyword search tool below to find specific information within the annual report.-
 1
1 -
2
-
3
-
4
-
5
-
6
-
7
-
8
-
9
-
10
-
11
-
12
-
13
-
14
-
15
-
16
-
17
-
18
-
19
-
20
-
21
-
22
-
23
-
24
-
25
-
26
-
27
-
28
-
29
-
30
-
31
-
32
-
33
-
34
-
35
-
36
-
37
-
38
-
39
-
40
-
41
-
42
-
43
-
44
-
45
-
46
-
47
-
48
-
49
-
50
-
51
-
52
-
53
-
54
-
55
-
56
-
57
-
58
-
59
-
60
-
61
-
62
-
63
-
64
-
65
-
66
-
67
-
68
-
 69
69 -
 70
70 -
 71
71 -
 72
72 -
 73
73 -
 74
74 -
 75
75 -
 76
76 -
 77
77 -
 78
78 -
 79
79 -
 80
80 -
 81
81 -
 82
82 -
 83
83 -
 84
84 -
 85
85 -
 86
86 -
 87
87 -
 88
88 -
 89
89 -
90
-
91
-
92
-
93
-
94
-
95
-
96
-
97
-
98
-
99
-
100
-
101
-
102
-
103
-
104
-
105
-
106
-
107
-
108
-
109
-
110
-
111
-
112
-
113
-
114
-
115
-
116
-
117
-
118
-
119
-
120
-
121
-
122
-
123
-
124
-
125
-
126
-
127
-
128
-
129
-
130
-
131
-
132
-
133
-
134
-
135
-
136
-
137
 |
 |

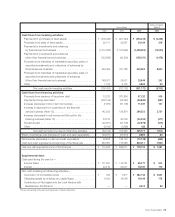
76 Sony Corporation
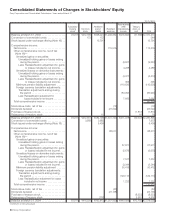
Consolidated Statements of Income
Sony Corporation and Consolidated Subsidiaries—Years ended March 31
Dollars in millions
Yen in millions (Note 3)
2003 2004 2005 2005
Sales and operating revenue:
Net sales (Note 6) . . . . . . . . . . . . . . . . . . . . . . . . . . . . . . . . . . . . .
¥6,916,042 ¥6,883,478 ¥6,565,010 $61,355
Financial service revenue . . . . . . . . . . . . . . . . . . . . . . . . . . . . . . . .
509,398 565,752 537,715 5,025
Other operating revenue . . . . . . . . . . . . . . . . . . . . . . . . . . . . . . . .
48,193 47,161 56,891 532
. . . . . . . . . . . . . . . . . . . . . . . . . . . . . . . . . . . . . . . . . . . . . . . . . . .
7,473,633 7,496,391 7,159,616 66,912
Costs and expenses:
Cost of sales (Notes 6, 18 and 19) . . . . . . . . . . . . . . . . . . . . . . . . .
4,979,421 5,058,205 5,000,112 46,730
Selling, general and administrative (Notes 17, 18 and 19). . . . . . . .
1,782,367 1,798,239 1,535,015 14,346
Financial service expenses . . . . . . . . . . . . . . . . . . . . . . . . . . . . . . .
486,464 505,550 482,576 4,510
Loss on sale, disposal or impairment of assets, net
(Notes 10 and 18) . . . . . . . . . . . . . . . . . . . . . . . . . . . . . . . . . . . .
39,941 35,495 27,994 261
. . . . . . . . . . . . . . . . . . . . . . . . . . . . . . . . . . . . . . . . . . . . . . . . . . .
7,288,193 7,397,489 7,045,697 65,847
Operating income . . . . . . . . . . . . . . . . . . . . . . . . . . . . . . . . . . . .
185,440 98,902 113,919 1,065
Other income:
Interest and dividends (Note 6). . . . . . . . . . . . . . . . . . . . . . . . . . . .
14,441 18,756 14,708 137
Royalty income . . . . . . . . . . . . . . . . . . . . . . . . . . . . . . . . . . . . . . .
32,375 34,244 31,709 296
Foreign exchange gain, net . . . . . . . . . . . . . . . . . . . . . . . . . . . . . .
1,928 18,059 ——
Gain on sale of securities investments, net (Notes 6 and 8) . . . . . .
72,552 11,774 5,437 51
Gain on change in interest in subsidiaries and equity investees
(Note 20) . . . . . . . . . . . . . . . . . . . . . . . . . . . . . . . . . . . . . . . . . . .
—4,870 16,322 153
Other . . . . . . . . . . . . . . . . . . . . . . . . . . . . . . . . . . . . . . . . . . . . . . .
36,232 34,587 29,447 275
. . . . . . . . . . . . . . . . . . . . . . . . . . . . . . . . . . . . . . . . . . . . . . . . . . .
157,528 122,290 97,623 912
Other expenses:
Interest . . . . . . . . . . . . . . . . . . . . . . . . . . . . . . . . . . . . . . . . . . . . .
27,314 27,849 24,578 230
Loss on devaluation of securities investments . . . . . . . . . . . . . . . .
23,198 16,481 3,715 35
Foreign exchange loss, net . . . . . . . . . . . . . . . . . . . . . . . . . . . . . .
——524 5
Other . . . . . . . . . . . . . . . . . . . . . . . . . . . . . . . . . . . . . . . . . . . . . . .
44,835 32,795 25,518 238
. . . . . . . . . . . . . . . . . . . . . . . . . . . . . . . . . . . . . . . . . . . . . . . . . . .
95,347 77,125 54,335 508
Income before income taxes. . . . . . . . . . . . . . . . . . . . . . . . . . . .
247,621 144,067 157,207 1,469
Income taxes (Note 21):
Current . . . . . . . . . . . . . . . . . . . . . . . . . . . . . . . . . . . . . . . . . . . . .
178,847 87,219 85,510 799
Deferred. . . . . . . . . . . . . . . . . . . . . . . . . . . . . . . . . . . . . . . . . . . . .
(98,016) (34,445) (69,466) (649)
. . . . . . . . . . . . . . . . . . . . . . . . . . . . . . . . . . . . . . . . . . . . . . . . . . .
80,831 52,774 16,044 150
Income before minority interest, equity in net income
(loss) of affiliated companies and cumulative effect
of an accounting change . . . . . . . . . . . . . . . . . . . . . . . . . . . . . .
166,790 91,293 141,163 1,319
Minority interest in income of consolidated subsidiaries . . . . . . . . .
6,581 2,379 1,651 15
Equity in net income (loss) of affiliated companies (Note 6) . . . . . . .
(44,690) 1,714 29,039 271
Income before cumulative effect of an accounting change . . . .
115,519 90,628 168,551 1,575
Cumulative effect of an accounting change
(2004: Net of income taxes of ¥0 million
(2005: Net of income taxes of ¥2,675 million) (Note 2) . . . . . . . .
—(2,117) (4,713) (44)
Net income . . . . . . . . . . . . . . . . . . . . . . . . . . . . . . . . . . . . . . . . . . . . . . . . ¥0,115,519 ¥0,088,511 ¥0,163,838 $01,531
(Continued on following page.)
BH6/30 Adobe PageMaker 6.0J /PPC