Sony 2005 Annual Report Download - page 75
Download and view the complete annual report
Please find page 75 of the 2005 Sony annual report below. You can navigate through the pages in the report by either clicking on the pages listed below, or by using the keyword search tool below to find specific information within the annual report.-
 1
1 -
2
-
3
-
4
-
5
-
6
-
7
-
8
-
9
-
10
-
11
-
12
-
13
-
14
-
15
-
16
-
17
-
18
-
19
-
20
-
21
-
22
-
23
-
24
-
25
-
26
-
27
-
28
-
29
-
30
-
31
-
32
-
33
-
34
-
35
-
36
-
37
-
38
-
39
-
40
-
41
-
42
-
43
-
44
-
45
-
46
-
47
-
48
-
49
-
50
-
51
-
52
-
53
-
54
-
55
-
56
-
57
-
58
-
59
-
60
-
61
-
62
-
63
-
64
-
 65
65 -
 66
66 -
 67
67 -
 68
68 -
 69
69 -
 70
70 -
 71
71 -
 72
72 -
 73
73 -
 74
74 -
 75
75 -
 76
76 -
 77
77 -
 78
78 -
 79
79 -
 80
80 -
 81
81 -
 82
82 -
 83
83 -
 84
84 -
 85
85 -
86
-
87
-
88
-
89
-
90
-
91
-
92
-
93
-
94
-
95
-
96
-
97
-
98
-
99
-
100
-
101
-
102
-
103
-
104
-
105
-
106
-
107
-
108
-
109
-
110
-
111
-
112
-
113
-
114
-
115
-
116
-
117
-
118
-
119
-
120
-
121
-
122
-
123
-
124
-
125
-
126
-
127
-
128
-
129
-
130
-
131
-
132
-
133
-
134
-
135
-
136
-
137
 |
 |

72 Sony Corporation
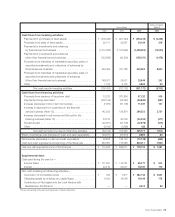
Segment Information
Sony Corporation and Consolidated Subsidiaries—Years ended March 31
SALES AND OPERATING REVENUE BY BUSINESS SEGMENT*
Yen in millions Dollars in millions**
Years ended March 31 2003 2004 2005 2005
Electronics . . . . . . . . . . . . . . . . . . . . . . . . . . . . . . . . . . . . . . . . . . .
¥4,624,181 ¥4,838,268 ¥4,786,236 $44,731
. . . . . . . . . . . . . . . . . . . . . . . . . . . . . . . . . . . . . . . . . . . . . . . . . . .
61.9.%64.5.%66.9.%
Game . . . . . . . . . . . . . . . . . . . . . . . . . . . . . . . . . . . . . . . . . . . . . .
936,274 753,732 702,524 6,566
. . . . . . . . . . . . . . . . . . . . . . . . . . . . . . . . . . . . . . . . . . . . . . . . . . .
12.5.10.1.9.8.
Music . . . . . . . . . . . . . . . . . . . . . . . . . . . . . . . . . . . . . . . . . . . . . . .
433,147 409,487 216,779 2,026
. . . . . . . . . . . . . . . . . . . . . . . . . . . . . . . . . . . . . . . . . . . . . . . . . . .
5.8.5.5.3.0.
Pictures . . . . . . . . . . . . . . . . . . . . . . . . . . . . . . . . . . . . . . . . . . . . .
802,770 756,370 733,677 6,857
. . . . . . . . . . . . . . . . . . . . . . . . . . . . . . . . . . . . . . . . . . . . . . . . . . .
10.7.10.1.10.2.
Financial Services . . . . . . . . . . . . . . . . . . . . . . . . . . . . . . . . . . . . .
509,398 565,752 537,715 5,025
. . . . . . . . . . . . . . . . . . . . . . . . . . . . . . . . . . . . . . . . . . . . . . . . . . .
6.8.7.5.7.5.
Other . . . . . . . . . . . . . . . . . . . . . . . . . . . . . . . . . . . . . . . . . . . . . . .
167,863 172,782 182,685 1,707
. . . . . . . . . . . . . . . . . . . . . . . . . . . . . . . . . . . . . . . . . . . . . . . . . . .
2.3.2.3.2.6.
Consolidated total . . . . . . . . . . . . . . . . . . . . . . . . . . . . . . . . . . . . .
¥7,473,633 ¥7,496,391 ¥7,159,616 $66,912
**Sales and operating revenue to customers.
**U.S. dollar amounts have been translated from yen, for convenience only, at the rate of ¥107=U.S.$1, the approximate Tokyo foreign exchange market rate as of March 31, 2005.
<ELECTRONICS SALES AND OPERATING REVENUE TO CUSTOMERS BY PRODUCT CATEGORY>
Yen in millions Dollars in millions*
Years ended March 31 2003 2004 2005 2005
Audio . . . . . . . . . . . . . . . . . . . . . . . . . . . . . . . . . . . . . . . . . . . . . . .
¥ 784,114 ¥ 675,496 ¥ 571,864 $ 5,345
. . . . . . . . . . . . . . . . . . . . . . . . . . . . . . . . . . . . . . . . . . . . . . . . . . . . . . . . . 17.0.%14.0.%12.0.%
Video . . . . . . . . . . . . . . . . . . . . . . . . . . . . . . . . . . . . . . . . . . . . . . .
828,308 949,261 1,034,736 9,670
. . . . . . . . . . . . . . . . . . . . . . . . . . . . . . . . . . . . . . . . . . . . . . . . . . .
17.9.19.6.21.6.
Televisions . . . . . . . . . . . . . . . . . . . . . . . . . . . . . . . . . . . . . . . . . . .
981,655 925,501 957,122 8,945
. . . . . . . . . . . . . . . . . . . . . . . . . . . . . . . . . . . . . . . . . . . . . . . . . . .
21.2.19.1.20.0.
Information and Communications . . . . . . . . . . . . . . . . . . . . . . . . .
836,724 834,757 778,374 7,275
. . . . . . . . . . . . . . . . . . . . . . . . . . . . . . . . . . . . . . . . . . . . . . . . . . .
18.1.17.3.16.3.
Semiconductors . . . . . . . . . . . . . . . . . . . . . . . . . . . . . . . . . . . . . .
204,710 253,237 246,314 2,302
. . . . . . . . . . . . . . . . . . . . . . . . . . . . . . . . . . . . . . . . . . . . . . . . . . .
4.4.5.2.5.1.
Components . . . . . . . . . . . . . . . . . . . . . . . . . . . . . . . . . . . . . . . . .
527,782 623,799 619,477 5,789
. . . . . . . . . . . . . . . . . . . . . . . . . . . . . . . . . . . . . . . . . . . . . . . . . . .
11.4.12.9.12.9.
Other . . . . . . . . . . . . . . . . . . . . . . . . . . . . . . . . . . . . . . . . . . . . . . .
460,888 576,217 578,349 5,405
. . . . . . . . . . . . . . . . . . . . . . . . . . . . . . . . . . . . . . . . . . . . . . . . . . .
10.0.11.9.12.1.
Total . . . . . . . . . . . . . . . . . . . . . . . . . . . . . . . . . . . . . . . . . . . . . . . .
¥4,624,181 ¥4,838,268 ¥4,786,236 $44,731
*U.S. dollar amounts have been translated from yen, for convenience only, at the rate of ¥107=U.S.$1, the approximate Tokyo foreign exchange market rate as of March 31, 2005.
Note: The above table is a breakdown of Electronics sales and operating revenue in Sony’s business segment information. The Electronics segment is managed as a single
operating segment by Sony’s management. Effective for the year ended March 31, 2005, Sony has partly changed its product category configuration. The main
changes are that AIWA product group has been moved from “Other” to “Audio” or “Video” or “Televisions”, and the set-top box product group has been moved from
“Video” to “Televisions”. Accordingly, sales and operating revenue for the years ended March 31, 2003 and 2004 have been restated to conform to the presentation for
the year ended March 31, 2005.
BH6/30 Adobe PageMaker 6.0J /PPC