Sony 2005 Annual Report Download - page 41
Download and view the complete annual report
Please find page 41 of the 2005 Sony annual report below. You can navigate through the pages in the report by either clicking on the pages listed below, or by using the keyword search tool below to find specific information within the annual report.-
 1
1 -
2
-
3
-
4
-
5
-
6
-
7
-
8
-
9
-
10
-
11
-
12
-
13
-
14
-
15
-
16
-
17
-
18
-
19
-
20
-
21
-
22
-
23
-
24
-
25
-
26
-
27
-
28
-
29
-
30
-
 31
31 -
 32
32 -
 33
33 -
 34
34 -
 35
35 -
 36
36 -
 37
37 -
 38
38 -
 39
39 -
 40
40 -
 41
41 -
 42
42 -
 43
43 -
 44
44 -
 45
45 -
 46
46 -
 47
47 -
 48
48 -
 49
49 -
 50
50 -
 51
51 -
52
-
53
-
54
-
55
-
56
-
57
-
58
-
59
-
60
-
61
-
62
-
63
-
64
-
65
-
66
-
67
-
68
-
69
-
70
-
71
-
72
-
73
-
74
-
75
-
76
-
77
-
78
-
79
-
80
-
81
-
82
-
83
-
84
-
85
-
86
-
87
-
88
-
89
-
90
-
91
-
92
-
93
-
94
-
95
-
96
-
97
-
98
-
99
-
100
-
101
-
102
-
103
-
104
-
105
-
106
-
107
-
108
-
109
-
110
-
111
-
112
-
113
-
114
-
115
-
116
-
117
-
118
-
119
-
120
-
121
-
122
-
123
-
124
-
125
-
126
-
127
-
128
-
129
-
130
-
131
-
132
-
133
-
134
-
135
-
136
-
137
 |
 |

38 Sony Corporation
album sales. In the Pictures segment, the cost of sales ratio also
improved primarily due to the substantial contribution from
Spider-Man 2.
Personnel related costs included in cost of sales decreased
by 52.5 billion yen compared with the previous fiscal year,
primarily within the Electronics segment.
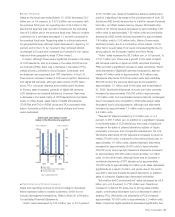
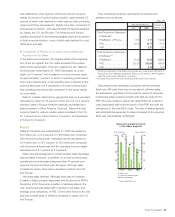
Research and development costs (all research and develop-
ment costs are included within cost of sales) for the fiscal year
ended March 31, 2005 decreased by 12.5 billion yen to 502.0
billion yen compared with the previous fiscal year. The ratio of
research and development costs to sales was 7.6 percent
compared to 7.5 percent in the previous fiscal year.
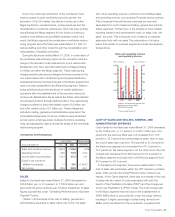
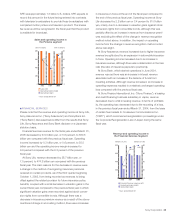
Selling, general and administrative expenses for the fiscal year
ended March 31, 2005 decreased by 263.2 billion yen, or 14.6
percent, to 1,535.0 billion yen compared with the previous fiscal
year. The ratio of selling, general and administrative expenses to
sales improved from 25.9 percent in the previous fiscal year to
23.2 percent. Year on year, the ratio of selling, general and
administrative expenses to sales improved from 21.2 percent to
19.0 percent in the Electronics segment, from 21.1 percent to
21.0 percent in the Game segment, and improved from 41.8
percent to 38.9 percent in the Music segment, and from 35.0
percent to 32.5 percent in the Pictures segment.
Personnel related costs in selling, general and administrative
expenses decreased by 169.3 billion yen compared with the
previous fiscal year mainly due to a decrease in severance
related expenses in the Electronics segment resulting from the
implementation of restructuring initiatives, and the fact that
personnel related costs in Sony’s recorded music business
outside Japan are no longer recorded within Sony’s consoli-
dated selling, general and administrative expenses due to the
establishment of SONY BMG mentioned above. In addition,
advertising and publicity expenses for the fiscal year decreased
by 51.6 billion yen compared to the previous fiscal year. This
was primarily due to the fact that advertising and publicity
expenses that were recorded in the Music segment decreased
due to the establishment of SONY BMG and a reduction in
advertising and publicity expenses in the Pictures segment.
Loss on sale, disposal or impairment of assets, net was
28.0 billion yen, compared with 35.5 billion in the previous fiscal
year. Although losses were recorded on the sale, disposal and
impairment of CRT and CRT television production equipment
in the Electronics segment, gains were recorded mainly from
the sale of land and buildings in both the Electronics and
Other segments.
OPERATING INCOME
Operating income for the fiscal year ended March 31, 2005
increased by 15.0 billion yen, or 15.2 percent, to 113.9 billion yen
compared with the previous fiscal year. The operating income
margin increased from 1.3 percent to 1.6 percent. The business
segments that contributed the most to operating income, in
descending order by amount of financial impact, were the
Pictures, Financial Services and Game segments. On the other
hand, the Electronics segment recorded an operating loss mainly
due to the appreciation of the yen against the U.S. dollar as well
as an increase in cost of sales that exceeded the reduction in sell-
ing, general and administrative expenses. For a further break-
down of operating income for each segment, please refer to
“Operating Performance by Business Segment” below.
OTHER INCOME AND EXPENSES
In the consolidated results for the fiscal year ended March 31,
2005, other income decreased by 24.7 billion yen, or 20.2
percent, to 97.6 billion yen, while other expenses decreased by
22.8 billion yen, or 29.5 percent, to 54.3 billion yen, compared
with the previous fiscal year. The net amount of other income
and other expenses was net other income of 43.3 billion yen, a
decrease of 1.9 billion yen, or 4.2 percent, compared with the
previous fiscal year.
A net foreign exchange loss of 0.5 billion yen was recorded in
the fiscal year ended March 31, 2005, compared to a net foreign
exchange gain of 18.1 billion yen recorded in the previous fiscal
year. The net foreign exchange loss was recorded because the
value of the yen, especially during the first quarter of the fiscal
year ended March 31, 2005, was lower than the value of the yen
at the time that Sony entered into foreign exchange forward
contracts and foreign currency option contracts. These con-
tracts are entered into by Sony to mitigate the foreign exchange
rate risk to cash flows that arises from settlements of foreign
currency denominated accounts receivable and accounts
payable, as well as foreign currency denominated transactions
between consolidated subsidiaries.
8
6
4
2
0
600
450
300
150
02003 2004 2005
6.4%
7.5% 7.6%
Research and development
expenses and as a percentage
of sales
■Research and development
expenses
●Percentage of sales
*Years ended March 31
*Excluding the Financial
Services segment
(Yen in billions) (%)
Cost of sales and selling, general
and administrative (SGA) expenses
as a percentage of sales
● Cost of sales/sales
● SGA/sales
*Years ended March 31
*Excluding the Financial
Services segment
(%)
80
60
40
20
02003 2004 2005
72.0% 73.5%
25.6% 25.9%
76.2%
23.2%
BH6/30 Adobe PageMaker 6.0J /PPC