Sony 2005 Annual Report Download - page 72
Download and view the complete annual report
Please find page 72 of the 2005 Sony annual report below. You can navigate through the pages in the report by either clicking on the pages listed below, or by using the keyword search tool below to find specific information within the annual report.-
 1
1 -
2
-
3
-
4
-
5
-
6
-
7
-
8
-
9
-
10
-
11
-
12
-
13
-
14
-
15
-
16
-
17
-
18
-
19
-
20
-
21
-
22
-
23
-
24
-
25
-
26
-
27
-
28
-
29
-
30
-
31
-
32
-
33
-
34
-
35
-
36
-
37
-
38
-
39
-
40
-
41
-
42
-
43
-
44
-
45
-
46
-
47
-
48
-
49
-
50
-
51
-
52
-
53
-
54
-
55
-
56
-
57
-
58
-
59
-
60
-
61
-
 62
62 -
 63
63 -
 64
64 -
 65
65 -
 66
66 -
 67
67 -
 68
68 -
 69
69 -
 70
70 -
 71
71 -
 72
72 -
 73
73 -
 74
74 -
 75
75 -
 76
76 -
 77
77 -
 78
78 -
 79
79 -
 80
80 -
 81
81 -
 82
82 -
83
-
84
-
85
-
86
-
87
-
88
-
89
-
90
-
91
-
92
-
93
-
94
-
95
-
96
-
97
-
98
-
99
-
100
-
101
-
102
-
103
-
104
-
105
-
106
-
107
-
108
-
109
-
110
-
111
-
112
-
113
-
114
-
115
-
116
-
117
-
118
-
119
-
120
-
121
-
122
-
123
-
124
-
125
-
126
-
127
-
128
-
129
-
130
-
131
-
132
-
133
-
134
-
135
-
136
-
137
 |
 |

Sony Corporation 69
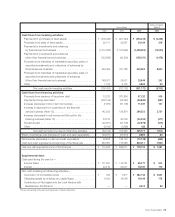
Five-Year Summary of Selected Financial Data
Sony Corporation and Consolidated Subsidiaries—Years ended March 31
Dollars in
millions except
Yen in millions per share
except per share amounts amounts
2001 2002 2003 2004 2005 2005
FOR THE YEAR
Sales and operating revenue . . . . . . . . . . . . . . . . . .
¥7,314,824 ¥7,578,258 ¥7,473,633 ¥7,496,391 ¥7,159,616 $66,912
Operating income . . . . . . . . . . . . . . . . . . . . . . . . . .
225,346 134,631 185,440 98,902 113,919 1,065
Income before income taxes . . . . . . . . . . . . . . . . . .
265,868 92,775 247,621 144,067 157,207 1,469
Income taxes . . . . . . . . . . . . . . . . . . . . . . . . . . . . . .
115,534 65,211 80,831 52,774 16,044 150
Equity in net income (loss) of affiliated companies . .
(44,455) (34,472) (44,690) 1,714 29,039 271
Income before cumulative effect of accounting
changes . . . . . . . . . . . . . . . . . . . . . . . . . . . . . . . . .
121,227 9,332 115,519 90,628 168,551 1,575
Net income . . . . . . . . . . . . . . . . . . . . . . . . . . . . . . .
16,754 15,310 115,519 88,511 163,838 1,531
Per share data:
Common stock
Income before cumulative effect of
accounting changes
—Basic . . . . . . . . . . . . . . . . . . . . . . . . . . . . .
¥ 132.64.¥ 10.21.¥ 125.74.¥ 98.26.¥ 180.96.$ 1.69.
—Diluted . . . . . . . . . . . . . . . . . . . . . . . . . . . .
124.36.10.18.118.21.89.03.162.59.1.52.
Net income
—Basic . . . . . . . . . . . . . . . . . . . . . . . . . . . . .
18.33.16.72.125.74.95.97.175.90.1.64.
—Diluted . . . . . . . . . . . . . . . . . . . . . . . . . . . .
19.28.16.67.118.21.87.00.158.07.1.48.
Cash dividends . . . . . . . . . . . . . . . . . . . . . . . . .
25.00.25.00.25.00.25.00.25.00.0.23.
Number of weighted-average shares for basic
per share data (thousands of shares) . . . . . . .
913,932 918,462 919,706 923,650 931,125
Subsidiary tracking stock
Net income (loss)
—Basic . . . . . . . . . . . . . . . . . . . . . . . . . . . . .
—(15.87.)(41.98.)(41.80.)17.21.0.16.
Number of weighted-average shares for basic
per share data (thousands of shares) . . . . . . .
—3,072 3,072 3,072 3,072
Depreciation and amortization* . . . . . . . . . . . . . . . .
¥ 348,268 ¥ 354,135 ¥ 351,925 ¥ 366,269 ¥ 372,865 $ 3,485
Capital expenditures (additions to property, plant
and equipment) . . . . . . . . . . . . . . . . . . . . . . . . . . .
465,209 326,734 261,241 378,264 356,818 3,335
Research and development expenses . . . . . . . . . . .
416,708 433,214 443,128 514,483 502,008 4,692
AT YEAR-END
Net working capital . . . . . . . . . . . . . . . . . . . . . . . . .
¥ 830,734 ¥ 778,716 ¥ 719,166 ¥ 381,140 ¥ 746,803 $ 6,979
Stockholders’ equity . . . . . . . . . . . . . . . . . . . . . . . .
2,315,453 2,370,410 2,280,895 2,378,002 2,870,338 26,826
Stockholders’ equity per share attributable to
common stock . . . . . . . . . . . . . . . . . . . . . . . . . . . .
¥ 2,521.19.¥ 2,570.31.¥ 2,466.81.¥ 2,563.67.¥ 2,872.21.$ 26.84.
Total assets . . . . . . . . . . . . . . . . . . . . . . . . . . . . . . .
¥7,827,966.¥8,185,795.¥8,370,545.¥9,090,662.¥9,499,100.$88,777
Number of shares issued at year-end
(thousands of shares):
Common stock. . . . . . . . . . . . . . . . . . . . . . . . . . .
919,617 919,744 922,385 926,418 997,211
Subsidiary tracking stock . . . . . . . . . . . . . . . . . . .
—3,072 3,072 3,072 3,072
*Including amortization expenses for intangible assets and for deferred insurance acquisition costs
BH6/30 Adobe PageMaker 6.0J /PPC