Sony 2005 Annual Report Download - page 98
Download and view the complete annual report
Please find page 98 of the 2005 Sony annual report below. You can navigate through the pages in the report by either clicking on the pages listed below, or by using the keyword search tool below to find specific information within the annual report.-
 1
1 -
2
-
3
-
4
-
5
-
6
-
7
-
8
-
9
-
10
-
11
-
12
-
13
-
14
-
15
-
16
-
17
-
18
-
19
-
20
-
21
-
22
-
23
-
24
-
25
-
26
-
27
-
28
-
29
-
30
-
31
-
32
-
33
-
34
-
35
-
36
-
37
-
38
-
39
-
40
-
41
-
42
-
43
-
44
-
45
-
46
-
47
-
48
-
49
-
50
-
51
-
52
-
53
-
54
-
55
-
56
-
57
-
58
-
59
-
60
-
61
-
62
-
63
-
64
-
65
-
66
-
67
-
68
-
69
-
70
-
71
-
72
-
73
-
74
-
75
-
76
-
77
-
78
-
79
-
80
-
81
-
82
-
83
-
84
-
85
-
86
-
87
-
 88
88 -
 89
89 -
 90
90 -
 91
91 -
 92
92 -
 93
93 -
 94
94 -
 95
95 -
 96
96 -
 97
97 -
 98
98 -
 99
99 -
 100
100 -
 101
101 -
 102
102 -
 103
103 -
 104
104 -
 105
105 -
 106
106 -
 107
107 -
 108
108 -
109
-
110
-
111
-
112
-
113
-
114
-
115
-
116
-
117
-
118
-
119
-
120
-
121
-
122
-
123
-
124
-
125
-
126
-
127
-
128
-
129
-
130
-
131
-
132
-
133
-
134
-
135
-
136
-
137
 |
 |

Sony Corporation 95
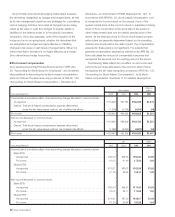
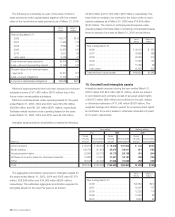
ended March 31, 2003 and 2004 was insignificant. For the
year ended March 31, 2005, Sony booked ¥12,631 million
($118 million) of net unrealized gain on trading securities
which is mainly derived from the general accounts in the life
insurance business reclassified from the separate accounts as
explained above.
assets of ¥164,461 million ($1,537 million) were reclassified from
“Securities investments and other” to each respective account by
nature including “Marketable securities” and “Cash and cash
equivalents”. Of the total, ¥154,528 million ($1,444 million) was
reclassified to “Marketable securities”.
The net change in the unrealized gains or losses on trading
securities that has been included in earnings during the years
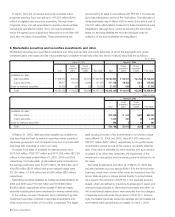
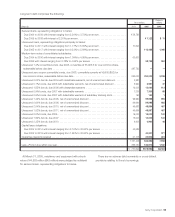
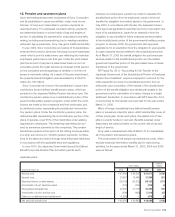
The following table presents the gross unrealized losses on, and fair value of, Sony’s investment securities with unrealized losses,
aggregated by investment category and the length of time that individual investment securities have been in a continuous unrealized loss
position, at March 31, 2005.
Yen in millions
Less than 12 months 12 months or more Total
Unrealized Unrealized Unrealized
Fair value losses Fair value losses Fair value losses
Available-for-sale:
Debt securities . . . . . . . . . . . . . . . . . . . . . . . . . . . . . . . . . . . .
¥242,388 ¥(2,044) ¥41,523 ¥(420) ¥283,911 ¥(2,464)
Equity securities . . . . . . . . . . . . . . . . . . . . . . . . . . . . . . . . . . .
11,010 (457) 1,225 (357) 12,235 (814)
Held-to-maturity securities . . . . . . . . . . . . . . . . . . . . . . . . . . . . .
239 (0) 660 (13) 899 (13)
Total . . . . . . . . . . . . . . . . . . . . . . . . . . . . . . . . . . . . . . . . . . . .
¥253,637 ¥(2,501) ¥43,408 ¥(790) ¥297,045 ¥(3,291)
Dollars in millions
Less than 12 months 12 months or more Total
Unrealized Unrealized Unrealized
Fair value losses Fair value losses Fair value losses
Available-for-sale:
Debt securities . . . . . . . . . . . . . . . . . . . . . . . . . . . . . . . . . . . .
$2,265 $(19) $388 $(4) $2,653 $(23)
Equity securities . . . . . . . . . . . . . . . . . . . . . . . . . . . . . . . . . . .
103 (5) 12 (3) 115 (8)
Held-to-maturity securities . . . . . . . . . . . . . . . . . . . . . . . . . . . . .
2(0) 6 (0) 8 (0)
Total . . . . . . . . . . . . . . . . . . . . . . . . . . . . . . . . . . . . . . . . . . . . $2,370 $(24) $406 $(7) $2,776 $(31)
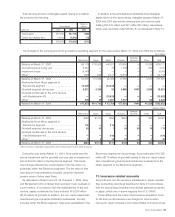
In evaluating the factors for available-for-sale securities whose
fair values are readily determinable, Sony presumes a decline in
value to be other-than-temporary if the fair value of the security
is 20 percent or more below its original cost for an extended
period of time (generally a period of up to six to twelve months).
This criteria is employed as a threshold to identify securities
which may have a decline in value that is other-than-temporary.
The presumption of an other-than-temporary impairment in such
cases may be overcome if there is evidence to support that the
decline is temporary in nature due to the existence of other
factors which overcome the duration or magnitude of the de-
cline. On the other hand, there may be cases where impairment
losses are recognized when the decline in the fair value of the
security is not more than 20 percent or such decline has not
existed for an extended period of time, as a result of considering
specific factors which may indicate the decline in the fair value is
other-than-temporary.
At March 31, 2005, Sony determined that the decline in value
for securities with unrealized losses shown in the above table is
not other-than-temporary in nature.
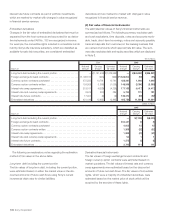
9. Leased assets
Sony leases certain communication and commercial equipment,
plant, office space, warehouses, employees’ residential facilities
and other assets.
An analysis of leased assets under capital leases is as follows:
Dollars in
Yen in millions millions
March 31 2004 2005 2005
Class of property:
Land . . . . . . . . . . . . . . . . . .
¥(00,174 ¥(00,181 $(002
Buildings . . . . . . . . . . . . . . .
12,421 11,089 104
Machinery, equipment
and others . . . . . . . . . . . . .
36,907 33,747 315
Accumulated depreciation . .
(19,385) (18,509) (173)
. . . . . . . . . . . . . . . . . . . .
¥(30,117 ¥(26,508 $(248
BH6/30 Adobe PageMaker 6.0J /PPC