Sony 2005 Annual Report Download - page 99
Download and view the complete annual report
Please find page 99 of the 2005 Sony annual report below. You can navigate through the pages in the report by either clicking on the pages listed below, or by using the keyword search tool below to find specific information within the annual report.-
 1
1 -
2
-
3
-
4
-
5
-
6
-
7
-
8
-
9
-
10
-
11
-
12
-
13
-
14
-
15
-
16
-
17
-
18
-
19
-
20
-
21
-
22
-
23
-
24
-
25
-
26
-
27
-
28
-
29
-
30
-
31
-
32
-
33
-
34
-
35
-
36
-
37
-
38
-
39
-
40
-
41
-
42
-
43
-
44
-
45
-
46
-
47
-
48
-
49
-
50
-
51
-
52
-
53
-
54
-
55
-
56
-
57
-
58
-
59
-
60
-
61
-
62
-
63
-
64
-
65
-
66
-
67
-
68
-
69
-
70
-
71
-
72
-
73
-
74
-
75
-
76
-
77
-
78
-
79
-
80
-
81
-
82
-
83
-
84
-
85
-
86
-
87
-
88
-
 89
89 -
 90
90 -
 91
91 -
 92
92 -
 93
93 -
 94
94 -
 95
95 -
 96
96 -
 97
97 -
 98
98 -
 99
99 -
 100
100 -
 101
101 -
 102
102 -
 103
103 -
 104
104 -
 105
105 -
 106
106 -
 107
107 -
 108
108 -
 109
109 -
110
-
111
-
112
-
113
-
114
-
115
-
116
-
117
-
118
-
119
-
120
-
121
-
122
-
123
-
124
-
125
-
126
-
127
-
128
-
129
-
130
-
131
-
132
-
133
-
134
-
135
-
136
-
137
 |
 |

96 Sony Corporation
Yen in Dollars in
millions millions
Year ending March 31:
2006 . . . . . . . . . . . . . . . . . . . . . . . . .
¥22,650 $212
2007 . . . . . . . . . . . . . . . . . . . . . . . . .
18,287 171
2008 . . . . . . . . . . . . . . . . . . . . . . . . .
12,202 114
2009 . . . . . . . . . . . . . . . . . . . . . . . . .
10,623 99
2010 . . . . . . . . . . . . . . . . . . . . . . . . .
8,874 83
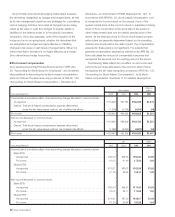
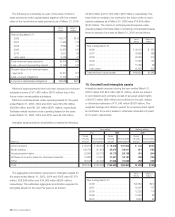
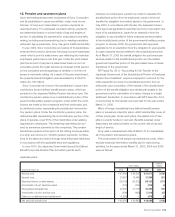
The aggregate amortization expenses for intangible assets for
the years ended March 31, 2003, 2004 and 2005 was ¥27,871
million, ¥28,866 million and ¥24,993 million ($234 million),
respectively. The estimated aggregate amortization expense for
intangible assets for the next five years is as follows:
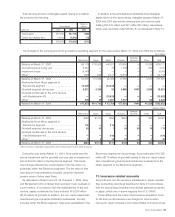
The following is a schedule by year of the future minimum
lease payments under capital leases together with the present
value of the net minimum lease payments as of March 31, 2005:
Yen in Dollars in
millions millions
Year ending March 31:
2006 . . . . . . . . . . . . . . . . . . . . . . . . .
¥15,211 $142
2007 . . . . . . . . . . . . . . . . . . . . . . . . .
11,062 103
2008 . . . . . . . . . . . . . . . . . . . . . . . . .
8,895 83
2009 . . . . . . . . . . . . . . . . . . . . . . . . .
10,873 102
2010 . . . . . . . . . . . . . . . . . . . . . . . . .
3,001 28
Later years . . . . . . . . . . . . . . . . . . . . .
5,428 51
Total minimum lease payments . . . . . . .
54,470 509
Less—Amount representing interest . . .
14,169 132
Present value of net minimum lease
payments . . . . . . . . . . . . . . . . . . . . . .
40,301 377
Less—Current obligations . . . . . . . . . . .
11,713 110
Long-term capital lease obligations . . . .
¥28,588 $267
Minimum lease payments have not been reduced by minimum
sublease income of ¥11,480 million ($107 million) due in the
future under noncancelable subleases.
Minimum rental expenses under operating leases for the years
ended March 31, 2003, 2004 and 2005 were ¥94,364 million,
¥92,649 million and ¥81,391 million ($761 million), respectively.
Sublease rentals received under operating leases for the years
ended March 31, 2003, 2004 and 2005 were ¥6,240 million,
¥2,923 million and ¥1,933 million ($18 million), respectively. The
total minimum rentals to be received in the future under noncan-
celable subleases as of March 31, 2005 were ¥14,954 million
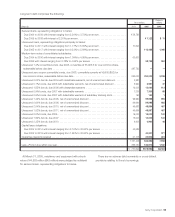
($140 million). The minimum rental payments required under
operating leases that have initial or remaining noncancelable lease
terms in excess of one year at March 31, 2005 are as follows:
Yen in Dollars in
millions millions
Year ending March 31:
2006 . . . . . . . . . . . . . . . . . . . . . . . . .
¥038,182 $0,357
2007 . . . . . . . . . . . . . . . . . . . . . . . . .
30,568 286
2008 . . . . . . . . . . . . . . . . . . . . . . . . .
22,993 215
2009 . . . . . . . . . . . . . . . . . . . . . . . . .
14,060 131
2010 . . . . . . . . . . . . . . . . . . . . . . . . .
10,496 98
Later years . . . . . . . . . . . . . . . . . . . . .
53,652 501
Total minimum future rentals . . . . . . . . .
¥169,951 $1,588
10. Goodwill and intangible assets
Intangible assets acquired during the year ended March 31,
2005 totaled ¥22,844 million ($213 million), which are subject
to amortization and primarily consist of acquired patent rights
of ¥6,673 million ($62 million) and software to be sold, leased
or otherwise marketed of ¥11,546 million ($108 million). The
weighted average amortization period for acquired patent rights
and software to be sold, leased or otherwise marketed is 8 years
and 3 years, respectively.
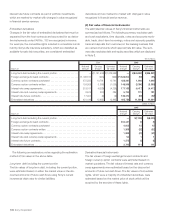
Intangible assets subject to amortization comprise the following:
Yen in millions Dollars in millions
2004 2005 2005
Gross Gross Gross
carrying Accumulated carrying Accumulated carrying Accumulated
March 31 amount amortization amount amortization amount amortization
Artist contracts . . . . . . . . . . . . . . . . . . . . . . . . . . . . . . . . . . . . . .
¥080,675 ¥0(68,300) ¥015,218 ¥(11,094) $0,142 $(104)
Music catalog . . . . . . . . . . . . . . . . . . . . . . . . . . . . . . . . . . . . . . .
109,795 (47,610) 65,674 (19,641) 614 (184)
Acquired patent rights . . . . . . . . . . . . . . . . . . . . . . . . . . . . . . . . .
52,996 (23,172) 55,173 (26,139) 516 (244)
Software to be sold, leased or otherwise marketed . . . . . . . . . . .
31,983 (13,577) 31,907 (16,181) 298 (151)
Other . . . . . . . . . . . . . . . . . . . . . . . . . . . . . . . . . . . . . . . . . . . . . .
55,048 (27,422) 27,648 (11,625) 258 (108)
Total . . . . . . . . . . . . . . . . . . . . . . . . . . . . . . . . . . . . . . . . . . . . . .
¥330,497 ¥(180,081) ¥195,620 ¥(84,680) $1,828 $(791)
BH6/30 Adobe PageMaker 6.0J /PPC