Sony 2005 Annual Report Download - page 4
Download and view the complete annual report
Please find page 4 of the 2005 Sony annual report below. You can navigate through the pages in the report by either clicking on the pages listed below, or by using the keyword search tool below to find specific information within the annual report.-
 1
1 -
 2
2 -
 3
3 -
 4
4 -
 5
5 -
 6
6 -
 7
7 -
 8
8 -
 9
9 -
 10
10 -
 11
11 -
 12
12 -
 13
13 -
 14
14 -
 15
15 -
16
-
17
-
18
-
19
-
20
-
21
-
22
-
23
-
24
-
25
-
26
-
27
-
28
-
29
-
30
-
31
-
32
-
33
-
34
-
35
-
36
-
37
-
38
-
39
-
40
-
41
-
42
-
43
-
44
-
45
-
46
-
47
-
48
-
49
-
50
-
51
-
52
-
53
-
54
-
55
-
56
-
57
-
58
-
59
-
60
-
61
-
62
-
63
-
64
-
65
-
66
-
67
-
68
-
69
-
70
-
71
-
72
-
73
-
74
-
75
-
76
-
77
-
78
-
79
-
80
-
81
-
82
-
83
-
84
-
85
-
86
-
87
-
88
-
89
-
90
-
91
-
92
-
93
-
94
-
95
-
96
-
97
-
98
-
99
-
100
-
101
-
102
-
103
-
104
-
105
-
106
-
107
-
108
-
109
-
110
-
111
-
112
-
113
-
114
-
115
-
116
-
117
-
118
-
119
-
120
-
121
-
122
-
123
-
124
-
125
-
126
-
127
-
128
-
129
-
130
-
131
-
132
-
133
-
134
-
135
-
136
-
137
 |
 |

2 Sony Corporation
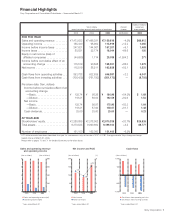
Financial Highlights by Business Segment
(Years ended March 31)
2005/2004
(Percent
(Yen in billions, %) 2003 2004 2005 change)
Sales
¥5,096.0 ¥5,042.3 ¥5,021.6 –0.4%
Operating (loss)
income
65.9.(6.8.)(34.3.)—%
Operating margin
1.3 — —%
Assets
2,974.0 2,995.3 (3,434.1)
Sales (Financial Services Revenues) and
Operating Income (Loss)
■ Sales
■ Operating (loss) income
■ Sales
■ Operating income
■ Sales
■ Operating income (loss)
■ Sales
■ Operating income
■ Financial Services revenues
■ Operating income
■ Sales
■ Operating loss
Game
Financial
Services
Music
2003 2004 2005
5,096.0
65.9
(6.8)
(34.3)
5,042.3 5,021.6
2003 2004 2005
955.0
780.2
67.6
729.8
43.2
112.7
2003 2004 2005
268.3
(28.3)
261.1
(12.1)
254.4
(4.1)
2003 2004 2005
802.8
59.0
35.2
756.4
63.9
733.7
2003 2004 2005
466.3 440.3
249.1
(6.0)
8.8
(28.3)
2003 2004 2005
22.8
537.3 593.5
55.2
560.6
55.5
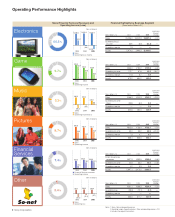
Operating Performance Highlights
2005/2004
(Percent
(Yen in billions, %) 2003 2004 2005 change)
Sales
¥955.0 ¥780.2 ¥729.8 –6.5%
Operating income
112.7 67.6 43.2 –36.1%
Operating margin
11.8 8.7 5.9
Assets
673.2 684.2 482.0
2005/2004
(Percent
(Yen in billions, %) 2003 2004 2005 change)
Sales
¥466.3 ¥440.3 ¥249.1 –43.4%
Operating income
(loss)
(28.3.)(6.0.)8.8.—%
Operating margin
——3.5 %
Assets
500.6 484.0 325.9
2005/2004
(Percent
(Yen in billions, %) 2003 2004 2005 change)
Sales
¥802.8 ¥756.4 ¥733.7 –3.0%
Operating income
59.0 35.2 63.9 +81.4%
Operating margin
7.3 4.7 8.7
Assets
868.4 856.5 863.1
2005/2004
(Percent
(Yen in billions, %) 2003 2004 2005 change)
Financial services
revenues
¥537.3 ¥593.5 ¥560.6 –5.6%
Operating income
22.8 55.2 55.5 0.+0.6%
Operating margin
4.2 9.3 0.9.9
Assets
2,897.1 3,475.0 3,885.5 0.0
2005/2004
(Percent
(Yen in billions, %) 2003 2004 2005 change)
Sales
¥261.1 ¥268.3 ¥254.4 –5.2%
Operating loss
(28.3.)(12.1.)(4.1.)—%
Operating margin
———%
Assets
333.5 371.7 347.9
66.5%
9.7%
3.3%
9.7%
7.4%
3.4%
Notes: 1. Sales =Sales and operating revenue
2. Operating margin=Operating income / Sales and operating revenue x 100
3. Includes intersegment transactions
(Yen in billions)
(Yen in billions)
(Yen in billions)
(Yen in billions)
(Yen in billions)
(Yen in billions)
Electronics
Game
Pictures
Other
Financial
Services
Music
S ONY AR -E 0629 Adobe PageMaker 6.0J /PPC