Sony 2005 Annual Report Download - page 40
Download and view the complete annual report
Please find page 40 of the 2005 Sony annual report below. You can navigate through the pages in the report by either clicking on the pages listed below, or by using the keyword search tool below to find specific information within the annual report.-
 1
1 -
2
-
3
-
4
-
5
-
6
-
7
-
8
-
9
-
10
-
11
-
12
-
13
-
14
-
15
-
16
-
17
-
18
-
19
-
20
-
21
-
22
-
23
-
24
-
25
-
26
-
27
-
28
-
29
-
 30
30 -
 31
31 -
 32
32 -
 33
33 -
 34
34 -
 35
35 -
 36
36 -
 37
37 -
 38
38 -
 39
39 -
 40
40 -
 41
41 -
 42
42 -
 43
43 -
 44
44 -
 45
45 -
 46
46 -
 47
47 -
 48
48 -
 49
49 -
 50
50 -
51
-
52
-
53
-
54
-
55
-
56
-
57
-
58
-
59
-
60
-
61
-
62
-
63
-
64
-
65
-
66
-
67
-
68
-
69
-
70
-
71
-
72
-
73
-
74
-
75
-
76
-
77
-
78
-
79
-
80
-
81
-
82
-
83
-
84
-
85
-
86
-
87
-
88
-
89
-
90
-
91
-
92
-
93
-
94
-
95
-
96
-
97
-
98
-
99
-
100
-
101
-
102
-
103
-
104
-
105
-
106
-
107
-
108
-
109
-
110
-
111
-
112
-
113
-
114
-
115
-
116
-
117
-
118
-
119
-
120
-
121
-
122
-
123
-
124
-
125
-
126
-
127
-
128
-
129
-
130
-
131
-
132
-
133
-
134
-
135
-
136
-
137
 |
 |

Sony Corporation 37
Due to the continued contraction of the worldwide music
market caused by slow worldwide economic growth, the
saturation of the CD market, the effects of piracy and other
illegal duplication, parallel imports, pricing pressures and the
diversification of customer preferences, Sony has been actively
repositioning the Music segment for the future by looking to
create a more effective and profitable business model. As a
result, the Music segment has undertaken a worldwide restruc-
turing program since the fiscal year ended March 31, 2001 to
reduce staffing and other costs through the consolidation and
rationalization of facilities worldwide.
During the fiscal year ended March 31, 2005, in continuation of
the worldwide restructuring program and in connection with the
merger of its recorded music business into a joint venture with
Bertelsmann AG, Sony recorded restructuring charges totaling
3.0 billion yen within the Music segment. These restructuring
charges exclude restructuring charges that were recorded in the
non-Japan based disc manufacturing and physical distribution
businesses that were formerly included in the Music segment but
have now been reclassified to the Electronics segment. Restruc-
turing activities included the shutdown of certain distribution
operations after the establishment of the recorded music joint
venture with Bertelsmann AG as well as the further rationalization
of overhead functions through staff reductions. The restructuring
charges consisted of personnel related costs of 0.9 billion yen
and other related costs of 2.1 billion yen. These charges are
included in selling, general and administrative expenses in the
consolidated statements of income. Positions were eliminated
across various employee levels, business functions, operating
units, and geographic regions during this phase of the worldwide
restructuring program.
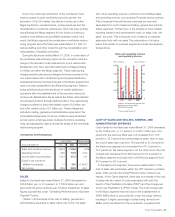
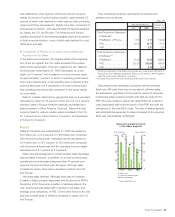
OPERATING PERFORMANCE
Yen in billions Percent change
Years ended March 31 2004 2005 2005/2004
Sales and operating revenue . .
7,496.4 7,159.6 –4.5%
Operating income . . . . . . . . . .
98.9 113.9 +15.2
Income before income taxes . .
144.1 157.2 +9.1
Equity in net income of
affiliated companies . . . . . . . .
1.7 29.0 +1,594.2
Net income . . . . . . . . . . . . . . .
88.5 163.8 +85.1
SALES
Sales for the fiscal year ended March 31, 2005 decreased by
336.8 billion yen, or 4.5 percent, to 7,159.6 billion yen com-
pared with the previous fiscal year. A further breakdown of sales
figures is presented under “Operating Performance by Business
Segment” below.
(“Sales” in this analysis of the ratio of selling, general and
administrative expenses to sales refers only to the “net sales”
and “other operating revenue” portions of consolidated sales
and operating revenue, and excludes Financial service revenue.
This is because Financial Service expenses are recorded
separately from cost of sales and selling, general and adminis-
trative expenses. Furthermore, in the analysis of cost of sales,
including research and development costs, to sales, only “net
sales” are used. This is because cost of sales is an expense
associated only with net sales. The calculations of all ratios
below that pertain to business segments include intersegment
transactions.)
COST OF SALES AND SELLING, GENERAL AND
ADMINISTRATIVE EXPENSES
Cost of sales for the fiscal year ended March 31, 2005 decreased
by 58.1 billion yen, or 1.1 percent, to 5,000.1 billion yen com-
pared with the previous fiscal year, but increased from 73.5
percent to 76.2 percent as a percentage of sales. Year on year,
the cost of sales ratio rose from 78.9 percent to 81.8 percent in
the Electronics segment and increased from 70.1 percent to
73.0 percent in the Game segment. On the other hand, the cost
of sales ratio decreased from 58.5 percent to 57.2 percent in
the Music segment and improved in the Pictures segment from
60.0 percent to 58.7 percent.
In the Electronics segment, there was a deterioration in the
cost of sales ratio particularly within the CRT television, portable
audio, DVD recorder (including PSX) and video camera busi-
nesses. In the Game segment, there was an increase in the cost
of sales ratio as a result of costs associated with both the
launch of the PlayStation Portable (“PSP”) and the changeover
to the new PlayStation 2 (“PS2”) model. The cost of sales ratio
in the Music segment improved due to the establishment of
SONY BMG which is accounted for under the equity method
resulting in a higher percentage of sales being derived from
SMEJ which benefited from the contribution of greatest hits
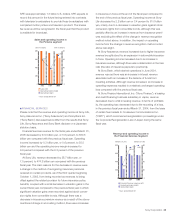
Sales and operating revenue
and operating income
■ Sales and operating revenue (left)
■ Operating income (right)
● Operating margin
*Years ended March 31
(Yen in billions) (Yen in billions)
8,000
6,000
4,000
2,000
0
800
600
400
200
0
2003 2004 2005
2.5%
1.3% 1.5%
BH6/30 Adobe PageMaker 6.0J /PPC