Sony 2005 Annual Report Download - page 59
Download and view the complete annual report
Please find page 59 of the 2005 Sony annual report below. You can navigate through the pages in the report by either clicking on the pages listed below, or by using the keyword search tool below to find specific information within the annual report.-
 1
1 -
2
-
3
-
4
-
5
-
6
-
7
-
8
-
9
-
10
-
11
-
12
-
13
-
14
-
15
-
16
-
17
-
18
-
19
-
20
-
21
-
22
-
23
-
24
-
25
-
26
-
27
-
28
-
29
-
30
-
31
-
32
-
33
-
34
-
35
-
36
-
37
-
38
-
39
-
40
-
41
-
42
-
43
-
44
-
45
-
46
-
47
-
48
-
 49
49 -
 50
50 -
 51
51 -
 52
52 -
 53
53 -
 54
54 -
 55
55 -
 56
56 -
 57
57 -
 58
58 -
 59
59 -
 60
60 -
 61
61 -
 62
62 -
 63
63 -
 64
64 -
 65
65 -
 66
66 -
 67
67 -
 68
68 -
 69
69 -
70
-
71
-
72
-
73
-
74
-
75
-
76
-
77
-
78
-
79
-
80
-
81
-
82
-
83
-
84
-
85
-
86
-
87
-
88
-
89
-
90
-
91
-
92
-
93
-
94
-
95
-
96
-
97
-
98
-
99
-
100
-
101
-
102
-
103
-
104
-
105
-
106
-
107
-
108
-
109
-
110
-
111
-
112
-
113
-
114
-
115
-
116
-
117
-
118
-
119
-
120
-
121
-
122
-
123
-
124
-
125
-
126
-
127
-
128
-
129
-
130
-
131
-
132
-
133
-
134
-
135
-
136
-
137
 |
 |

56 Sony Corporation
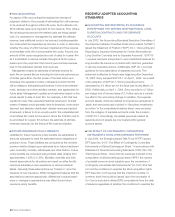
(Yen in billions)
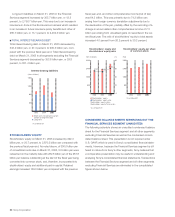
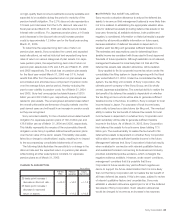
Cash flows
■ Cash flows from operating activities
■ Cash flows from investing activities
■ Cash flows from financing activities
*Years ended March 31
1,000
500
0
–500
–1,000 2003 2004 2005
Investing Activities: During the fiscal year, Sony used 931.2
billion yen of net cash in investing activities, an increase of 169.4
billion yen, or 22.2 percent, compared with the previous fiscal
year. Of this total, all segments excluding the Financial Services
segment used 472.1 billion yen of net cash in investing activities,
an increase of 119.6 billion yen, or 33.9 percent, compared with
the previous fiscal year, and the Financial Services segment
used 421.4 billion yen in net cash, an increase of 19.8 billion
yen, or 4.9 percent.
During the fiscal year, purchases of fixed assets (capital
expenditures) were made, primarily due to proactive capital
expenditures in semiconductors mainly within the Electronics
segment, mostly associated with system LSI including the Cell
next-generation, high-performance processor, as well as
investments associated with the establishment of the amorphous
TFT LCD panel manufacturing joint venture S-LCD. Within the
Financial Services segment, payments for investments and
advances exceeded proceeds from maturities of marketable
securities, sales of securities investments and collections of
advances primarily as a result of both investments in mainly
Japanese fixed income securities resulting from an increase in
insurance premiums at Sony Life, and a housing loan campaign
carried out at Sony Bank.
Compared with the previous fiscal year, net cash used in
investing activities increased, due primarily to investments
associated with S-LCD. In all segments excluding the Financial
Services segment, the amount of payments for investments and
advances increased by 124.8 billion yen from 33.3 billion yen to
158.2 billion yen due to the abovementioned investments at S-
LCD. On the other hand, in the Financial Services segment, net
cash used in investing activities increased due to an increase in
proceeds from investments and advances year on year.
In all segments excluding the Financial Services segment, the
difference between cash generated from operating activities and
cash used in investing activities was 13.3 billion yen for the fiscal
year, a decrease of 35.3 billion yen, or 72.6 percent, compared
with the previous fiscal year.
Financing Activities: During the fiscal year ended March 31,
2005, 205.2 billion yen of net cash was provided by financing
activities. Of the total, 95.4 billion yen of net cash was used for
financing activities in all segments excluding the Financial
Services segment as a result of 89.7 billion yen being used for
the repayment of long term debt and 23.0 billion yen in cash
being used for the payment of dividends.
In the fiscal year ended March 31, 2005, net cash was used
for financing activities compared to 153.8 billion yen of net cash
procured in the previous fiscal year. This change was due mainly
to the issuance of 250.0 billion yen in euro yen convertible
bonds (bonds with stock acquisition rights) within the previous
fiscal year.
In the Financial Services segment, as a result of a 294.4 billion
yen increase in customer deposits due to factors such as an
increase in insurance-in-force at Sony Life and an increase in
deposits from customers in the banking business, 256.4 billion
yen was procured by financing activities.
Accounting for all these factors and the effect of exchange
rate changes, the total outstanding balance of cash and cash
equivalents at the end of the fiscal year decreased by 70.1 billion
yen, or 8.3 percent, to 779.1 billion yen, compared with the end
of the previous fiscal year. The total outstanding balance of cash
and cash equivalents of all segments excluding the Financial
Services segment decreased by 73.2 billion yen, or 12.3
percent, to 519.7 billion yen, and for the Financial Services
segment, increased by 3.1 billion, or 1.2 percent, to 259.4 billion
yen, compared with the end of the previous fiscal year.
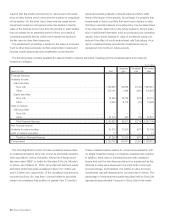
CONDENSED STATEMENTS OF CASH FLOWS
SEPARATING OUT THE FINANCIAL SERVICES SEGMENT
(UNAUDITED)
The following schedule shows unaudited condensed statements
of cash flow for the Financial Services segment and all other
segments excluding the Financial Services segment as well as
condensed consolidated statements of cash flow. These
presentations are not required under U.S. GAAP, which is used
in Sony’s consolidated financial statements. However, because
the Financial Services segment is different in nature from Sony’s
other segments, Sony believes that a comparative presentation
may be useful in understanding and analyzing Sony’s consoli-
dated financial statements. Transactions between the Financial
Services segment and all other segments excluding the Financial
Services segment are eliminated in the consolidated figures
shown below.
BH6/30 Adobe PageMaker 6.0J /PPC