Sony 2005 Annual Report Download - page 82
Download and view the complete annual report
Please find page 82 of the 2005 Sony annual report below. You can navigate through the pages in the report by either clicking on the pages listed below, or by using the keyword search tool below to find specific information within the annual report.-
 1
1 -
2
-
3
-
4
-
5
-
6
-
7
-
8
-
9
-
10
-
11
-
12
-
13
-
14
-
15
-
16
-
17
-
18
-
19
-
20
-
21
-
22
-
23
-
24
-
25
-
26
-
27
-
28
-
29
-
30
-
31
-
32
-
33
-
34
-
35
-
36
-
37
-
38
-
39
-
40
-
41
-
42
-
43
-
44
-
45
-
46
-
47
-
48
-
49
-
50
-
51
-
52
-
53
-
54
-
55
-
56
-
57
-
58
-
59
-
60
-
61
-
62
-
63
-
64
-
65
-
66
-
67
-
68
-
69
-
70
-
71
-
 72
72 -
 73
73 -
 74
74 -
 75
75 -
 76
76 -
 77
77 -
 78
78 -
 79
79 -
 80
80 -
 81
81 -
 82
82 -
 83
83 -
 84
84 -
 85
85 -
 86
86 -
 87
87 -
 88
88 -
 89
89 -
 90
90 -
 91
91 -
 92
92 -
93
-
94
-
95
-
96
-
97
-
98
-
99
-
100
-
101
-
102
-
103
-
104
-
105
-
106
-
107
-
108
-
109
-
110
-
111
-
112
-
113
-
114
-
115
-
116
-
117
-
118
-
119
-
120
-
121
-
122
-
123
-
124
-
125
-
126
-
127
-
128
-
129
-
130
-
131
-
132
-
133
-
134
-
135
-
136
-
137
 |
 |

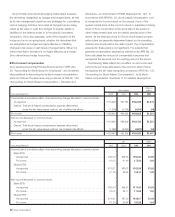
Sony Corporation 79
Dollars in millions
Yen in millions (Note 3)
2003 2004 2005 2005
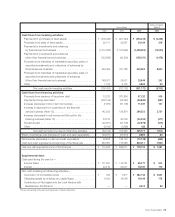
Cash flows from investing activities:
Payments for purchases of fixed assets . . . . . . . . . . . . . . . . . . .
¥ (275,285) ¥ (427,344) ¥ (453,445) $ (4,238)
Proceeds from sales of fixed assets . . . . . . . . . . . . . . . . . . . . . .
25,711 33,987 34,184 319
Payments for investments and advances
by financial service business . . . . . . . . . . . . . . . . . . . . . . . . . . .
(1,012,508) (1,167,945) (1,309,092) (12,235)
Payments for investments and advances
(other than financial service business) . . . . . . . . . . . . . . . . . . . .
(123,839) (33,329) (158,151) (1,478)
Proceeds from maturities of marketable securities, sales of
securities investments and collections of advances by
financial service business . . . . . . . . . . . . . . . . . . . . . . . . . . . . .
529,395 791,188 923,593 8,632
Proceeds from maturities of marketable securities, sales of
securities investments and collections of advances
(other than financial service business) . . . . . . . . . . . . . . . . . . . .
148,977 35,521 25,849 242
Other . . . . . . . . . . . . . . . . . . . . . . . . . . . . . . . . . . . . . . . . . . . . .
1,124 6,130 5,890 55
Net cash used in investing activities . . . . . . . . . . . . . . .
(706,425) (761,792) (931,172) (8,703)
Cash flows from financing activities:
Proceeds from issuance of long-term debt . . . . . . . . . . . . . . . . .
12,323 267,864 57,232 535
Payments of long-term debt . . . . . . . . . . . . . . . . . . . . . . . . . . . .
(238,144) (32,042) (94,862) (887)
Increase (decrease) in short-term borrowings . . . . . . . . . . . . . . .
(7,970) (57,708) 11,397 107
Increase in deposits from customers in the financial
service business (Note 13) . . . . . . . . . . . . . . . . . . . . . . . . . . . .
142,023 129,874 294,352 2,751
Increase (decrease) in call money and bills sold in the
banking business (Note 12) . . . . . . . . . . . . . . . . . . . . . . . . . . .
24,700 30,300 (40,400) (377)
Dividends paid . . . . . . . . . . . . . . . . . . . . . . . . . . . . . . . . . . . . . .
(22,871) (23,106) (22,978) (215)
Other . . . . . . . . . . . . . . . . . . . . . . . . . . . . . . . . . . . . . . . . . . . . .
(3,195) (1,899) 436 4
Net cash provided by (used in) financing activities . . . . .
(93,134) 313,283 205,177 1,918
Effect of exchange rate changes on cash and cash equivalents . . .
(24,971) (47,973) 8,890 83
Net increase (decrease) in cash and cash equivalents . . . . . . . . . .
29,258 136,153 (70,108) (655)
Cash and cash equivalents at beginning of the fiscal year . . . . . . .
683,800 713,058 849,211 7,936
Cash and cash equivalents at end of the fiscal year . . . . . . . . . . . . . . . . . . ¥ 713,058 ¥ 849,211 ¥ 779,103 $ 7,281
Supplemental data:
Cash paid during the year for—
Income taxes . . . . . . . . . . . . . . . . . . . . . . . . . . . . . . . . . . . . . . .
¥ 171,531 ¥ 114,781 ¥ 65,477 $ 612
Interest . . . . . . . . . . . . . . . . . . . . . . . . . . . . . . . . . . . . . . . . . . . .
22,216 22,571 18,187 170
Non-cash investing and financing activities—
Conversion of convertible bonds . . . . . . . . . . . . . . . . . . . . . . . .
¥ 344 ¥ 7,977 ¥ 282,744 $ 2,641
Obtaining assets by entering into capital lease . . . . . . . . . . . . . .
9,034 18,298 19,049 178
Contribution of Net assets into the Joint Venture with
Bertelsmann AG (Note 6) . . . . . . . . . . . . . . . . . . . . . . . . . . . . .
——9,402 88
The accompanying notes are an integral part of these statements.
BH6/30 Adobe PageMaker 6.0J /PPC