Sony 2005 Annual Report Download - page 44
Download and view the complete annual report
Please find page 44 of the 2005 Sony annual report below. You can navigate through the pages in the report by either clicking on the pages listed below, or by using the keyword search tool below to find specific information within the annual report.-
 1
1 -
2
-
3
-
4
-
5
-
6
-
7
-
8
-
9
-
10
-
11
-
12
-
13
-
14
-
15
-
16
-
17
-
18
-
19
-
20
-
21
-
22
-
23
-
24
-
25
-
26
-
27
-
28
-
29
-
30
-
31
-
32
-
33
-
 34
34 -
 35
35 -
 36
36 -
 37
37 -
 38
38 -
 39
39 -
 40
40 -
 41
41 -
 42
42 -
 43
43 -
 44
44 -
 45
45 -
 46
46 -
 47
47 -
 48
48 -
 49
49 -
 50
50 -
 51
51 -
 52
52 -
 53
53 -
 54
54 -
55
-
56
-
57
-
58
-
59
-
60
-
61
-
62
-
63
-
64
-
65
-
66
-
67
-
68
-
69
-
70
-
71
-
72
-
73
-
74
-
75
-
76
-
77
-
78
-
79
-
80
-
81
-
82
-
83
-
84
-
85
-
86
-
87
-
88
-
89
-
90
-
91
-
92
-
93
-
94
-
95
-
96
-
97
-
98
-
99
-
100
-
101
-
102
-
103
-
104
-
105
-
106
-
107
-
108
-
109
-
110
-
111
-
112
-
113
-
114
-
115
-
116
-
117
-
118
-
119
-
120
-
121
-
122
-
123
-
124
-
125
-
126
-
127
-
128
-
129
-
130
-
131
-
132
-
133
-
134
-
135
-
136
-
137
 |
 |

Sony Corporation 41
■ELECTRONICS
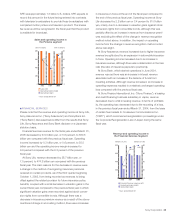
Sales for the fiscal year ended March 31, 2005 decreased 20.7
billion yen, or 0.4 percent, to 5,021.6 billion yen compared with
the previous fiscal year. An operating loss of 34.3 billion in the
Electronics segment was recorded compared to the operating
loss of 6.8 billion yen in the previous fiscal year. Sales to outside
customers on a yen basis decreased 1.1 percent compared to
the previous fiscal year. Regarding sales to outside customers
by geographical area, although sales decreased in Japan by 10
percent and in the U.S. by 4 percent, they remained almost
unchanged in Europe and increased by 9 percent in non-Japan
Asia and other geographic areas (“Other Areas”).
In Japan, although there was a significant increase in the sales
of LCD televisions, and an increase in the sales of DVD record-
ers (including PSX), there was a decrease in the sales of PCs,
cellular phones, primarily to Sony Ericsson, broadcast- and
professional-use equipment and CRT televisions. In the U.S.,
there was an increase in sales of LCD rear projection televisions
and digital still cameras, although sales mainly of CRT televi-
sions, PCs, computer displays and portable audio declined.
In Europe, sales increased, primarily of digital still cameras,
LCD televisions and plasma televisions. However, there was
a decrease in the sales mainly of CRT televisions and portable
audio. In Other Areas, sales mainly of digital still cameras,
CD-R/RW and DVD+/-R/RW drives and PCs increased while
sales of primarily portable audio, optical pickups and home
audio decreased.
● Performance by Product Category
Sales and operating revenue by product category discussed
below represent sales to outside customers, which do not
include intersegment transactions. Refer to Note 25 of Notes to
Consolidated Financial Statements.
“Audio” sales decreased by 103.6 billion yen, or 15.3 percent,
to 571.9 billion yen. Sales of headphone stereos declined as a
result of a significant decrease in the unit shipments of both CD
format and MD format devices due to a shift in demand towards
hard disc- and flash-based memory players. Worldwide ship-
ments of CD format devices decreased by approximately 3.68
million units to approximately 7.28 million units and worldwide
shipments of MD format devices decreased by approximately
1.44 million units to 1.92 million units. Sales of home audio
declined primarily due to a contraction of the market. On the
other hand, overall sales of car audio increased slightly due to
strong sales in the European market and Other Areas.
“Video” sales increased by 85.5 billion yen, or 9.0 percent, to
1,034.7 billion yen. There was a growth in the sales of digital
still cameras outside of Japan and DVD recorders (including
PSX) recorded a significant increase in sales worldwide. World-
wide shipments of digital still cameras increased by approxi-
mately 4.0 million units to approximately 14.0 million units.
Worldwide shipments of DVD recorders were approximately
650,000 units in the previous fiscal year but increased to
approximately 1.7 million units in the fiscal year ended March
31, 2005. Worldwide shipments of home-use video cameras
increased by approximately 750,000 units to approximately
7.35 million units, but overall sales remained almost unchanged,
due to increased price competition. DVD-Video player sales
decreased due to pricing pressure, although unit shipments
increased by approximately 1.0 million units to approximately
9.5 million units.
“Televisions” sales increased by 31.6 billion yen, or 3.4
percent, to 957.1 billion yen. In addition to a significant increase
in worldwide sales of LCD televisions, there was a significant
increase in the sales of plasma televisions outside of Japan,
particularly in Europe, and of projection televisions in the U.S.
Worldwide shipments of LCD televisions increased by approxi-
mately 570,000 units, compared to the previous fiscal year, to
approximately 1.0 million units; plasma television shipments
increased by approximately 90,000 units to approximately
300,000 units; and projection televisions shipments increased
by approximately 280,000 units to approximately 1.2 million
units. On the other hand, although there was an increase in
worldwide shipments of CRT televisions by approximately
100,000 units to approximately 9.5 million units, sales decreased
significantly as a result of a fall in unit prices due to the contin-
ued shift in demand towards flat panel televisions. In addition,
sales of computer displays also decreased worldwide.
“Information and Communications” sales decreased by 56.4
billion yen, or 6.8 percent, to 778.4 billion yen. Despite an
increase in notebook PC sales due to strong sales outside
Japan, overall sales decreased due to a decrease in sales of
desktop PCs. Worldwide unit shipments of PCs increased
approximately 100,000 units to approximately 3.3 million units.
Sales of personal digital assistants decreased significantly due
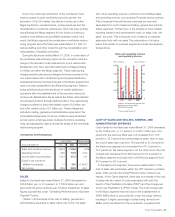
(Yen in billions) (Yen in billions)
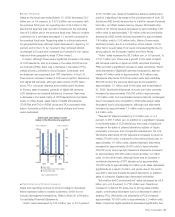
Sales and operating income
(loss) in the Electronics segment
■ Sales (left)
■ Operating income (loss) (right)
● Operating margin
*Years ended March 31
6,000
4,000
2,000
0
–2,000
600
400
200
0
–200
2003 2004 2005
1.3%
–0.7%
–0.1%
BH6/30 Adobe PageMaker 6.0J /PPC