Sony 2005 Annual Report Download - page 53
Download and view the complete annual report
Please find page 53 of the 2005 Sony annual report below. You can navigate through the pages in the report by either clicking on the pages listed below, or by using the keyword search tool below to find specific information within the annual report.-
 1
1 -
2
-
3
-
4
-
5
-
6
-
7
-
8
-
9
-
10
-
11
-
12
-
13
-
14
-
15
-
16
-
17
-
18
-
19
-
20
-
21
-
22
-
23
-
24
-
25
-
26
-
27
-
28
-
29
-
30
-
31
-
32
-
33
-
34
-
35
-
36
-
37
-
38
-
39
-
40
-
41
-
42
-
 43
43 -
 44
44 -
 45
45 -
 46
46 -
 47
47 -
 48
48 -
 49
49 -
 50
50 -
 51
51 -
 52
52 -
 53
53 -
 54
54 -
 55
55 -
 56
56 -
 57
57 -
 58
58 -
 59
59 -
 60
60 -
 61
61 -
 62
62 -
 63
63 -
64
-
65
-
66
-
67
-
68
-
69
-
70
-
71
-
72
-
73
-
74
-
75
-
76
-
77
-
78
-
79
-
80
-
81
-
82
-
83
-
84
-
85
-
86
-
87
-
88
-
89
-
90
-
91
-
92
-
93
-
94
-
95
-
96
-
97
-
98
-
99
-
100
-
101
-
102
-
103
-
104
-
105
-
106
-
107
-
108
-
109
-
110
-
111
-
112
-
113
-
114
-
115
-
116
-
117
-
118
-
119
-
120
-
121
-
122
-
123
-
124
-
125
-
126
-
127
-
128
-
129
-
130
-
131
-
132
-
133
-
134
-
135
-
136
-
137
 |
 |
50 Sony Corporation
Long-term liabilities on March 31, 2005 in the Financial
Services segment increased by 305.7 billion yen, or 12.5
percent, to 2,756.7 billion yen. This was due to an increase in
insurance-in-force in the life insurance business which resulted
in an increase in future insurance policy benefits and other of
285.7 billion yen, or 13.1 percent, to 2,464.3 billion yen.
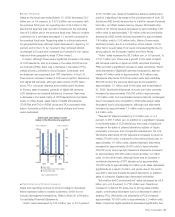
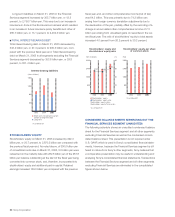
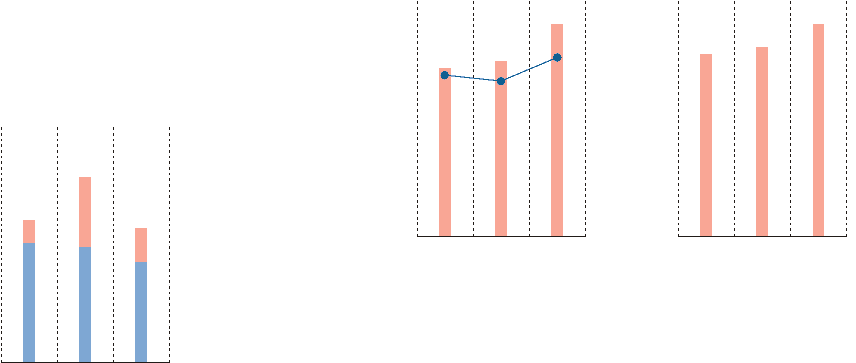
■TOTAL INTEREST-BEARING DEBT
Total interest-bearing debt on March 31, 2005 decreased by
343.4 billion yen, or 27.4 percent, to 909.3 billion yen, com-
pared with the previous fiscal year-end. Total interest-bearing
debt on March 31, 2005 in all segments excluding the Financial
Services segment decreased by 353.6 billion yen, or 29.8
percent, to 831.4 billion yen.
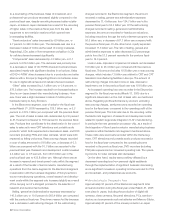
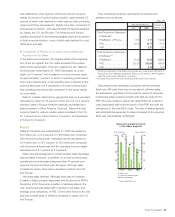
STOCKHOLDERS’ EQUITY
Stockholders’ equity on March 31, 2005 increased by 492.3
billion yen, or 20.7 percent, to 2,870.3 billion yen compared with
the previous fiscal year-end. As noted above, of 300.0 billion yen
of convertible bonds due on March 31, 2005, 5.0 billion yen were
redeemed on the maturity date with 282.8 billion yen of the 287.8
billion yen balance outstanding at the start of the fiscal year being
converted into common stock, and, therefore, incorporated into
stockholders’ equity and additional paid-in capital. Retained
earnings increased 139.0 billion yen compared with the previous
fiscal year-end, and other comprehensive income (net of tax)
was 64.3 billion. This was primarily due to 74.2 billion yen
arising from foreign currency translation adjustments due to
the devaluation of the yen, partially offset by the recording of a
change in accumulated other comprehensive income of 7.3
billion yen arising from unrealized gains on securities in the cur-
rent fiscal year. The ratio of stockholders’ equity to total assets
increased 4.0 percent from 26.2 percent to 30.2 percent.
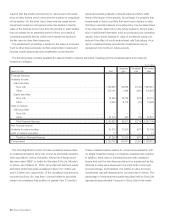
CONDENSED BALANCE SHEETS SEPARATING OUT THE
FINANCIAL SERVICES SEGMENT (UNAUDITED)
The following schedule shows an unaudited condensed balance
sheet for the Financial Services segment and all other segments
excluding Financial Services as well as the condensed consoli-
dated balance sheet. This presentation is not required under
U.S. GAAP, which is used in Sony’s consolidated financial state-
ments. However, because the Financial Services segment is dif-
ferent in nature from Sony’s other segments, Sony believes that
a comparative presentation may be useful in understanding and
analyzing Sony’s consolidated financial statements. Transactions
between the Financial Services segment and all other segments
excluding Financial Services are eliminated in the consolidated
figures shown below.
(Yen in billions)
Interest-bearing liabilities
■Short-term (including the current
portion of long-term debt)
■Long-term
*As of March 31
1,600
1,200
800
400
02003 2004 2005
(Yen)
Stockholders’ equity per share
of common stock
*As of March 31
3,200
2,400
1,600
800
02003 2004 2005
(Yen in billions)
Stockholders’ equity and
stockholders’ equity ratio
■ Stockholders’ equity
● Stockholders’ equity ratio
Stockholders’ equity ratio=
Stockholders’ equity/Total assets
*As of March 31
(%)
40
30
20
10
0
3,200
2,400
1,600
800
02003 2004 2005
27.2% 26.2%
30.2%
BH6/30 Adobe PageMaker 6.0J /PPC