Sysco 2011 Annual Report Download - page 100
Download and view the complete annual report
Please find page 100 of the 2011 Sysco annual report below. You can navigate through the pages in the report by either clicking on the pages listed below, or by using the keyword search tool below to find specific information within the annual report.-
 1
1 -
2
-
3
-
4
-
5
-
6
-
7
-
8
-
9
-
10
-
11
-
12
-
13
-
14
-
15
-
16
-
17
-
18
-
19
-
20
-
21
-
22
-
23
-
24
-
25
-
26
-
27
-
28
-
29
-
30
-
31
-
32
-
33
-
34
-
35
-
36
-
37
-
38
-
39
-
40
-
41
-
42
-
43
-
44
-
45
-
46
-
47
-
48
-
49
-
50
-
51
-
52
-
53
-
54
-
55
-
56
-
57
-
58
-
59
-
60
-
61
-
62
-
63
-
64
-
65
-
66
-
67
-
68
-
69
-
70
-
71
-
72
-
73
-
74
-
75
-
76
-
77
-
78
-
79
-
80
-
81
-
82
-
83
-
84
-
85
-
86
-
87
-
88
-
89
-
 90
90 -
 91
91 -
 92
92 -
 93
93 -
 94
94 -
 95
95 -
 96
96 -
 97
97 -
 98
98 -
 99
99 -
 100
100 -
 101
101 -
 102
102 -
 103
103 -
 104
104 -
 105
105
 |
 |

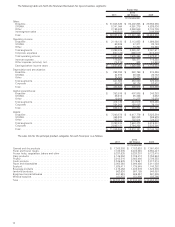
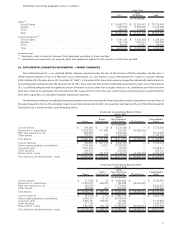
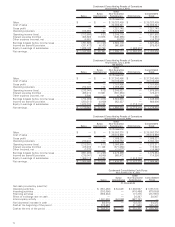
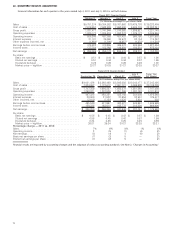
22. QUARTERLY RESULTS (UNAUDITED)
Financial information for each quarter in the years ended July 2, 2011 and July 3, 2010 is set forth below:
October 2 January 1 April 2 July 2 Fiscal Year
Fiscal 2011 Quarter Ended
(In thousands except for per share data)
Sales ........................................ $9,751,274 $ 9,384,852 $ 9,761,660 $10,425,703 $ 39,323,489
Cost of sales ................................... 7,919,857 7,642,908 7,950,800 8,488,776 32,002,341
Gross profit .................................... 1,831,417 1,741,944 1,810,860 1,936,927 7,321,148
Operating expenses .............................. 1,325,177 1,304,919 1,383,373 1,376,177 5,389,646
Operating income ................................ 506,240 437,025 427,487 560,750 1,931,502
Interest expense ................................ 31,101 28,060 28,972 30,134 118,267
Other expense (income), net ........................ (1,684) (1,300) (6,957) (4,278) (14,219)
Earnings before income taxes ....................... 476,823 410,265 405,472 534,894 1,827,454
Income taxes ................................... 177,754 152,092 146,994 198,584 675,424
Net earnings ................................... $ 299,069 $ 258,173 $ 258,478 $ 336,310 $ 1,152,030
Per share:
Basic net earnings .............................. $ 0.51 $ 0.44 $ 0.44 $ 0.57 $ 1.96
Diluted net earnings . . . ......................... 0.51 0.44 0.44 0.57 1.96
Dividends declared ............................. 0.25 0.26 0.26 0.26 1.03
Market price — high/low ......................... 32-27 30-28 31-27 33-28 33-27
September 26 December 26 March 27
July 3
(14 Weeks)
Fiscal Year
(53 Weeks)
Fiscal 2010 Quarter Ended
(In thousands except for per share data)
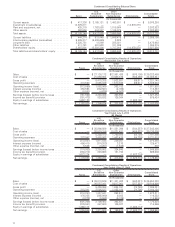
Sales ....................................... $9,081,426 $ 8,868,499 $ 8,945,093 $10,348,477 $ 37,243,495
Cost of sales ................................. 7,334,067 7,173,612 7,261,721 8,366,609 30,136,009
Gross profit .................................. 1,747,359 1,694,887 1,683,372 1,981,868 7,107,486
Operating expenses ............................ 1,250,031 1,232,536 1,251,269 1,397,782 5,131,618
Operating income .............................. 497,328 462,351 432,103 584,086 1,975,868
Interest expense ............................... 33,800 31,522 27,654 32,501 125,477
Other (income), net ............................. (2,012) (1,138) 1,028 2,924 802
Earnings before income taxes...................... 465,540 431,967 403,421 548,661 1,849,589
Income taxes ................................. 139,335 163,618 155,773 210,880 669,606
Net earnings.................................. $ 326,205 $ 268,349 $ 247,648 $ 337,781 $ 1,179,983
Per share:
Basic net earnings ............................ $ 0.55 $ 0.45 $ 0.42 $ 0.57 $ 1.99
Diluted net earnings ........................... 0.55 0.45 0.42 0.57 1.99
Dividends declared............................ 0.24 0.25 0.25 0.25 0.99
Market price — high/low . ....................... 26-21 29-24 30-27 32-28 32-21
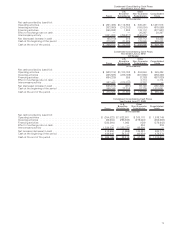
Percentage change — 2011 vs. 2010:
Sales ....................................... 7% 6% 9% 1% 6%
Operating income .............................. 2 (5) (1) (4) (2)
Net earnings.................................. (8) (4) 4 (0) (2)
Basic net earnings per share ...................... (7) (2) 5 — (2)
Diluted net earnings per share ..................... (7) (2) 5 — (2)
Financial results are impacted by accounting changes and the adoption of various accounting standards. See Note 2, “Changes in Accounting.”
76