Sysco 2011 Annual Report Download - page 39
Download and view the complete annual report
Please find page 39 of the 2011 Sysco annual report below. You can navigate through the pages in the report by either clicking on the pages listed below, or by using the keyword search tool below to find specific information within the annual report.-
 1
1 -
2
-
3
-
4
-
5
-
6
-
7
-
8
-
9
-
10
-
11
-
12
-
13
-
14
-
15
-
16
-
17
-
18
-
19
-
20
-
21
-
22
-
23
-
24
-
25
-
26
-
27
-
28
-
 29
29 -
 30
30 -
 31
31 -
 32
32 -
 33
33 -
 34
34 -
 35
35 -
 36
36 -
 37
37 -
 38
38 -
 39
39 -
 40
40 -
 41
41 -
 42
42 -
 43
43 -
 44
44 -
 45
45 -
 46
46 -
 47
47 -
 48
48 -
 49
49 -
50
-
51
-
52
-
53
-
54
-
55
-
56
-
57
-
58
-
59
-
60
-
61
-
62
-
63
-
64
-
65
-
66
-
67
-
68
-
69
-
70
-
71
-
72
-
73
-
74
-
75
-
76
-
77
-
78
-
79
-
80
-
81
-
82
-
83
-
84
-
85
-
86
-
87
-
88
-
89
-
90
-
91
-
92
-
93
-
94
-
95
-
96
-
97
-
98
-
99
-
100
-
101
-
102
-
103
-
104
-
105
 |
 |

As a part of our ongoing strategic analysis, we regularly evaluate business opportunities, including potential acquisitions and sales of
assets and businesses.
•Developing and effectively integrating a comprehensive, enterprise-wide talent management process: Our ability to drive results and grow
our business is directly linked to having the best talent in the industry. We are committed to the continued enhancement of our talent
management programs in terms of how we recruit, select, train and develop our associates throughout Sysco as well as succession
planning. Our ultimate objective is to provide our associates with outstanding opportunities for professional growth and career
development.
Business Transformation Project
In fiscal 2011, we substantially completed the design and build phases of our multi-year Business Transformation Project and we are testing
the underlying ERP system and processes through a pilot implementation. We took more time to test the underlying ERP system and processes in
fiscal 2011 than we originally anticipated. Our pilot operating company implemented the project and our shared services center became active in
its support role in the fourth quarter of fiscal 2011. We are also taking additional time in fiscal 2012 to improve the underlying systems prior to
larger scale deployment. These actions have caused a delay in the project of approximately six to twelve months and until we reach the point
where the underlying system functions as intended, our deployment timeline is still being determined. Although we expect the investment in the
Business Transformation Project to provide meaningful benefits to the company over the long-term, the costs will exceed the benefits during the
testing and deployment stages of implementation, including fiscal 2012.
Gross project expenses related to the Business Transformation Project were $102.0 million in fiscal 2011 or $0.11 per share, $81.1 million in
fiscal 2010 or $0.09 per share and $35.7 million in fiscal 2009 or $0.04 per share. Our cash outlay for fiscal 2011 was $278.8 million, of which
approximately $196 million was capitalized. Provided the improvements needed in the underlying systems are obtained in the first half of fiscal
2012, we anticipate the software will be ready for its intended use in the second half of fiscal 2012, which will result in reduced capitalization as
compared to fiscal 2011 and increased expense from both software amortization and deployment costs. We will also incur increased costs from
the ramp up of our shared services center, continuing costs for additional phases of our Business Transformation Project and information
technology support costs. Some of these increased costs will be partially offset by benefits obtained from the project, primarily in reduced
headcount, however the costs will not exceed the benefits in fiscal 2012. We expect our gross project expenses related to the Business
Transformation Project for fiscal 2012 to be approximately $280 million to $300 million and capital expenditures to be approximately $100 million
to $120 million.
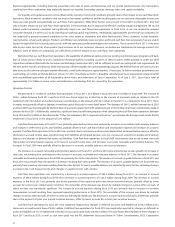
Results of Operations
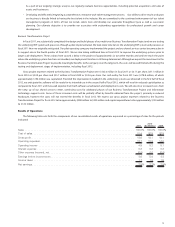
The following table sets forth the components of our consolidated results of operations expressed as a percentage of sales for the periods
indicated:
2011
2010
(53 Weeks) 2009
Sales ....................................................................... 100.0% 100.0% 100.0%
Cost of sales.................................................................. 81.4 80.9 80.9
Gross profit................................................................... 18.6 19.1 19.1
Operating expenses ............................................................. 13.7 13.8 14.0
Operating income .............................................................. 4.9 5.3 5.1
Interest expense . .............................................................. 0.3 0.3 0.3
Other expense (income), net ....................................................... (0.0) 0.0 (0.0)
Earnings before income taxes . . . ................................................... 4.6 5.0 4.8
Income taxes . . . .............................................................. 1.7 1.8 1.9
Net earnings .................................................................. 2.9% 3.2% 2.9%
15