Sysco 2011 Annual Report Download - page 95
Download and view the complete annual report
Please find page 95 of the 2011 Sysco annual report below. You can navigate through the pages in the report by either clicking on the pages listed below, or by using the keyword search tool below to find specific information within the annual report.-
 1
1 -
2
-
3
-
4
-
5
-
6
-
7
-
8
-
9
-
10
-
11
-
12
-
13
-
14
-
15
-
16
-
17
-
18
-
19
-
20
-
21
-
22
-
23
-
24
-
25
-
26
-
27
-
28
-
29
-
30
-
31
-
32
-
33
-
34
-
35
-
36
-
37
-
38
-
39
-
40
-
41
-
42
-
43
-
44
-
45
-
46
-
47
-
48
-
49
-
50
-
51
-
52
-
53
-
54
-
55
-
56
-
57
-
58
-
59
-
60
-
61
-
62
-
63
-
64
-
65
-
66
-
67
-
68
-
69
-
70
-
71
-
72
-
73
-
74
-
75
-
76
-
77
-
78
-
79
-
80
-
81
-
82
-
83
-
84
-
 85
85 -
 86
86 -
 87
87 -
 88
88 -
 89
89 -
 90
90 -
 91
91 -
 92
92 -
 93
93 -
 94
94 -
 95
95 -
 96
96 -
 97
97 -
 98
98 -
 99
99 -
 100
100 -
 101
101 -
 102
102 -
 103
103 -
 104
104 -
 105
105
 |
 |

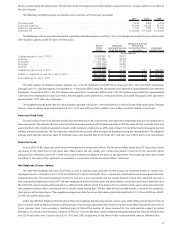
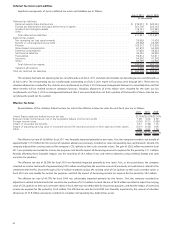
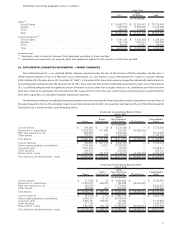
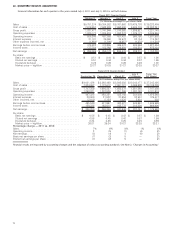
Information concerning geographic areas is as follows:
2011
2010
(53 Weeks) 2009
Fiscal Year
(In thousands)
Sales:
(1)
United States ................................................ $ 34,992,273 $ 33,268,481 $ 33,378,485
Canada . . . ................................................. 3,864,420 3,550,605 3,134,989
Other ..................................................... 466,796 424,409 339,856
Total ...................................................... $ 39,323,489 $ 37,243,495 $ 36,853,330
Long-lived assets:
(2)
United States ................................................ $ 3,161,724 $ 2,884,728 $ 2,725,200
Canada . . . ................................................. 321,185 291,514 223,320
Other ..................................................... 29,480 27,581 30,680
Total ...................................................... $ 3,512,389 $ 3,203,823 $ 2,979,200
(1)
Represents sales to external customers from businesses operating in these countries.
(2)
Long-lived assets represents net property, plant and equipment reported in the country in which they are held.
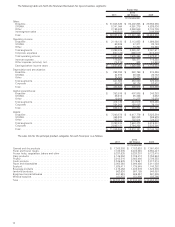
20. SUPPLEMENTAL GUARANTOR INFORMATION — PARENT GUARANTEE
Sysco International, ULC. is an unlimited liability company organized under the laws of the Province of British Columbia, Canada and is a
wholly-owned subsidiary of Sysco. In May 2002, Sysco International, Co., now known as Sysco International ULC, issued, in a private offering,
$200.0 million of 6.10% notes due in 2012 (see Note 10, “Debt”). In December 2002, these notes were exchanged for substantially identical notes in
an exchange offer registered under the Securities Act of 1933. These notes are fully and unconditionally guaranteed by Sysco. Sysco International,
ULC. is a holding company with no significant sources of income or assets, other than its equity interests in its subsidiaries and interest income
from loans made to its subsidiaries. The proceeds from the issuance of the 6.10% notes were used to repay commercial paper issued to fund the
fiscal 2002 acquisition of a Canadian broadline foodservice operation.
The following condensed consolidating financial statements present separately the financial position, results of operations and cash flows of
the parent guarantor (Sysco), the subsidiary issuer (Sysco International) and all other non-guarantor subsidiaries of Sysco (Other Non-Guarantor
Subsidiaries) on a combined basis and eliminating entries.
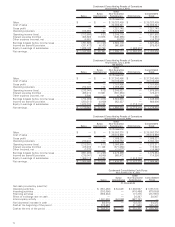
Sysco
Sysco
International
Other
Non-Guarantor
Subsidiaries Eliminations
Consolidated
Totals
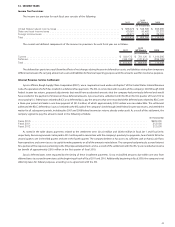
Condensed Consolidating Balance Sheet
July 2, 2011
(In thousands)
Current assets .......................... $ 354,450 $ 34 $ 5,378,398 $ — $ 5,732,882
Investment in subsidiaries .................. 13,588,905 371,866 128,461 (14,089,232) —
Plant and equipment, net ................... 569,567 — 2,942,822 — 3,512,389
Other assets ............................ 378,317 329 1,761,638 — 2,140,284
Total assets ............................ $ 14,891,239 $ 372,229 $ 10,211,319 $ (14,089,232) $ 11,385,555
Current liabilities ......................... $ 430,300 $ 201,016 $ 2,943,759 $ — $ 3,575,075
Intercompany payables (receivables) . . ......... 7,374,590 9,301 (7,383,891) — —
Long-term debt .......................... 2,227,483 — 52,034 — 2,279,517
Other liabilities .......................... 405,376 — 420,345 — 825,721
Shareholders’ equity . . .................... 4,453,490 161,912 14,179,072 (14,089,232) 4,705,242
Total liabilities and shareholders’ equity ......... $ 14,891,239 $ 372,229 $ 10,211,319 $ (14,089,232) $ 11,385,555
Sysco
Sysco
International
Other
Non-Guarantor
Subsidiaries Eliminations
Consolidated
Totals
Condensed Consolidating Balance Sheet
July 3, 2010
(In thousands)
Current assets ........................... $ 417,336 $ 33 $ 4,658,889 $ — $ 5,076,258
Investment in subsidiaries. .................. 14,979,871 465,641 142,925 (15,588,437) —
Plant and equipment, net . .................. 425,279 — 2,778,544 — 3,203,823
Other assets ............................ 362,658 597 1,670,365 — 2,033,620
Total assets ............................. $ 16,185,144 $ 466,271 $ 9,250,723 $ (15,588,437) $ 10,313,701
Current liabilities ......................... $ 444,274 $ 1,114 $ 2,563,810 $ — $ 3,009,198
Intercompany payables (receivables)............ 9,405,317 73,124 (9,478,441) — —
Long-term debt .......................... 2,225,781 199,881 47,000 — 2,472,662
Other liabilities........................... 411,781 — 592,534 — 1,004,315
Shareholders’ equity....................... 3,697,991 192,152 15,525,820 (15,588,437) 3,827,526
Total liabilities and shareholders’ equity. . . ....... $ 16,185,144 $ 466,271 $ 9,250,723 $ (15,588,437) $ 10,313,701
71