Sysco 2011 Annual Report Download - page 74
Download and view the complete annual report
Please find page 74 of the 2011 Sysco annual report below. You can navigate through the pages in the report by either clicking on the pages listed below, or by using the keyword search tool below to find specific information within the annual report.-
 1
1 -
2
-
3
-
4
-
5
-
6
-
7
-
8
-
9
-
10
-
11
-
12
-
13
-
14
-
15
-
16
-
17
-
18
-
19
-
20
-
21
-
22
-
23
-
24
-
25
-
26
-
27
-
28
-
29
-
30
-
31
-
32
-
33
-
34
-
35
-
36
-
37
-
38
-
39
-
40
-
41
-
42
-
43
-
44
-
45
-
46
-
47
-
48
-
49
-
50
-
51
-
52
-
53
-
54
-
55
-
56
-
57
-
58
-
59
-
60
-
61
-
62
-
63
-
 64
64 -
 65
65 -
 66
66 -
 67
67 -
 68
68 -
 69
69 -
 70
70 -
 71
71 -
 72
72 -
 73
73 -
 74
74 -
 75
75 -
 76
76 -
 77
77 -
 78
78 -
 79
79 -
 80
80 -
 81
81 -
 82
82 -
 83
83 -
 84
84 -
85
-
86
-
87
-
88
-
89
-
90
-
91
-
92
-
93
-
94
-
95
-
96
-
97
-
98
-
99
-
100
-
101
-
102
-
103
-
104
-
105
 |
 |
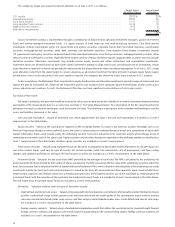
• Commercial paper included in short-term investments is valued using broker quotes that utilize observable market inputs. These are
included as a Level 2 measurement in the tables below.
• Money market funds are valued at the closing price reported by the fund sponsor from an actively traded exchange. These are included
within cash equivalents and restricted cash as Level 1 measurements in the tables below.
• The interest rate swap agreements, discussed further in Note 8, “Derivative Financial Instruments,” are valued using a swap valuation
model that utilizes an income approach using observable market inputs including interest rates, LIBOR swap rates and credit default swap
rates. These are included as a Level 2 measurement in the tables below.
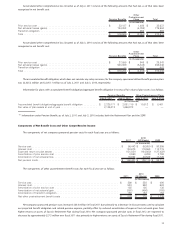
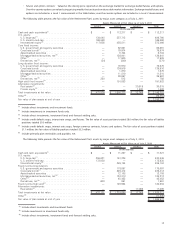
The following tables present the company’s assets measured at fair value on a recurring basis as of July 2, 2011 and July 3, 2010:
Level 1 Level 2 Level 3 Total
Assets Measured at Fair Value as of July 2, 2011
(In thousands)
Assets:
Cash and cash equivalents
Cash equivalents . . . ........................................ $ 141,350 $ 163,465 $ — $ 304,815
Restricted cash .............................................. 110,516 — — 110,516
Other assets
Interest rate swap agreements ................................. — 13,482 — 13,482
Total assets at fair value ........................................ $ 251,866 $ 176,947 $ — $ 428,813
Level 1 Level 2 Level 3 Total
Assets Measured at Fair Value as of July 3, 2010
(In thousands)
Assets:
Cash and cash equivalents
Cash equivalents . . . ........................................ $ 225,400 $ 199,047 $ — $ 424,447
Short-term investments ........................................ — 23,511 — 23,511
Restricted cash .............................................. 124,488 — — 124,488
Other assets
Interest rate swap agreements ................................. — 11,045 — 11,045
Total assets at fair value ........................................ $ 349,888 $ 233,603 $ — $ 583,491
The carrying values of accounts receivable and accounts payable approximated their respective fair values due to the short-term maturities of
these instruments. The fair value of Sysco’s total debt is estimated based on the quoted market prices for the same or similar issue or on the current
rates offered to the company for debt of the same remaining maturities. The fair value of total debt approximated $2,919.4 million and
$2,774.9 million as of July 2, 2011 and July 3, 2010, respectively. The carrying value of total debt was $2,668.5 million and $2,480.6 million as of
July 2, 2011 and July 3, 2010, respectively.
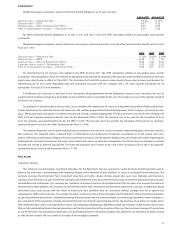
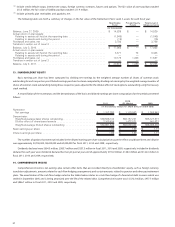
5. ALLOWANCE FOR DOUBTFUL ACCOUNTS
A summary of the activity in the allowance for doubtful accounts appears below:
2011 2010 2009
(In thousands)
Balance at beginning of period ............................................ $ 36,573 $ 36,078 $ 31,730
Charged to costs and expenses ........................................... 42,623 34,931 74,638
Allowance accounts resulting from acquisitions and other adjustments ................ 1,063 (139) 1,587
Customer accounts written off, net of recoveries . . . ............................ (37,823) (34,297) (71,877)
Balance at end of period................................................. $ 42,436 $ 36,573 $ 36,078
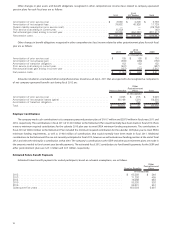
6. PLANT AND EQUIPMENT
A summary of plant and equipment, including the related accumulated depreciation, appears below:
July 2,
2011
July 3,
2010
Estimated Useful
Lives
(In thousands)
Plant and equipment, at cost:
Land........................................................ $ 348,168 $ 322,626
Buildings and improvements ....................................... 3,227,340 2,982,524 10-30 years
Fleet and equipment ............................................ 2,275,007 2,153,531 3-10 years
Computer hardware and software ..................................... 897,712 701,305 3-7 years
6,748,227 6,159,986
Accumulated depreciation . . . ....................................... (3,235,838) (2,956,163)
Net plant and equipment ........................................... $ 3,512,389 $ 3,203,823
50