Sysco 2011 Annual Report Download - page 96
Download and view the complete annual report
Please find page 96 of the 2011 Sysco annual report below. You can navigate through the pages in the report by either clicking on the pages listed below, or by using the keyword search tool below to find specific information within the annual report.-
 1
1 -
2
-
3
-
4
-
5
-
6
-
7
-
8
-
9
-
10
-
11
-
12
-
13
-
14
-
15
-
16
-
17
-
18
-
19
-
20
-
21
-
22
-
23
-
24
-
25
-
26
-
27
-
28
-
29
-
30
-
31
-
32
-
33
-
34
-
35
-
36
-
37
-
38
-
39
-
40
-
41
-
42
-
43
-
44
-
45
-
46
-
47
-
48
-
49
-
50
-
51
-
52
-
53
-
54
-
55
-
56
-
57
-
58
-
59
-
60
-
61
-
62
-
63
-
64
-
65
-
66
-
67
-
68
-
69
-
70
-
71
-
72
-
73
-
74
-
75
-
76
-
77
-
78
-
79
-
80
-
81
-
82
-
83
-
84
-
85
-
 86
86 -
 87
87 -
 88
88 -
 89
89 -
 90
90 -
 91
91 -
 92
92 -
 93
93 -
 94
94 -
 95
95 -
 96
96 -
 97
97 -
 98
98 -
 99
99 -
 100
100 -
 101
101 -
 102
102 -
 103
103 -
 104
104 -
 105
105
 |
 |

Sysco
Sysco
International
Other
Non-Guarantor
Subsidiaries Eliminations
Consolidated
Totals
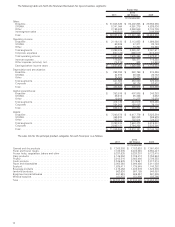
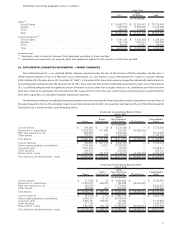
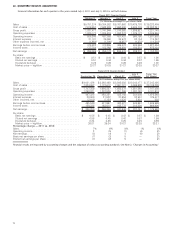
Condensed Consolidating Results of Operations
Year Ended July 2, 2011
(In thousands)
Sales .................................... $ — $ — $39,323,489 $ — $ 39,323,489
Cost of sales . . . ........................... — — 32,002,341 — 32,002,341
Gross profit ............................... — — 7,321,148 — 7,321,148
Operating expenses ......................... 313,550 127 5,075,969 — 5,389,646
Operating income (loss) ....................... (313,550) (127) 2,245,179 — 1,931,502
Interest expense (income) ..................... 453,593 10,973 (346,299) — 118,267
Other expense (income), net . . . ................ (5,581) — (8,638) — (14,219)
Earnings (losses) before income taxes ............. (761,562) (11,100) 2,600,116 — 1,827,454
Income tax (benefit) provision . . . ................ (281,472) (4,103) 960,999 — 675,424
Equity in earnings of subsidiaries ................ 1,632,120 60,758 — (1,692,878) —
Net earnings ............................... $ 1,152,030 $ 53,761 $ 1,639,117 $ (1,692,878) $ 1,152,030
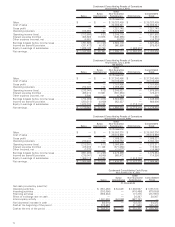
Sysco
Sysco
International
Other
Non-Guarantor
Subsidiaries Eliminations
Consolidated
Totals
Condensed Consolidating Results of Operations
Year Ended July 3, 2010
(53 Weeks)
(In thousands)
Sales .................................... $ — $ — $37,243,495 $ — $ 37,243,495
Cost of sales . . . ........................... — — 30,136,009 — 30,136,009
Gross profit ............................... — — 7,107,486 — 7,107,486
Operating expenses ......................... 272,047 112 4,859,459 — 5,131,618
Operating income (loss) ....................... (272,047) (112) 2,248,027 — 1,975,868
Interest expense (income) ..................... 496,410 10,961 (381,894) — 125,477
Other expense (income), net . . . ................ 5,546 — (4,744) — 802
Earnings (losses) before income taxes ............. (774,003) (11,073) 2,634,665 — 1,849,589
Income tax (benefit) provision . . . ................ (280,212) (4,009) 953,827 — 669,606
Equity in earnings of subsidiaries ................ 1,673,774 38,342 — (1,712,116) —
Net earnings ............................... $ 1,179,983 $ 31,278 $ 1,680,838 $ (1,712,116) $ 1,179,983
Sysco
Sysco
International
Other
Non-Guarantor
Subsidiaries Eliminations
Consolidated
Totals
Condensed Consolidating Results of Operations
Year Ended June 27, 2009
(In thousands)
Sales .................................... $ — $ — $36,853,330 $ — $ 36,853,330
Cost of sales . . . ........................... — — 29,816,999 — 29,816,999
Gross profit ............................... — — 7,036,331 — 7,036,331
Operating expenses ......................... 218,241 117 4,945,762 — 5,164,120
Operating income (loss) ....................... (218,241) (117) 2,090,569 — 1,872,211
Interest expense (income) ..................... 476,238 11,142 (371,058) — 116,322
Other (income), net .......................... (3,273) — (11,672) — (14,945)
Earnings (losses) before income taxes ............. (691,206) (11,259) 2,473,299 — 1,770,834
Income tax (benefit) provision . . . ................ (279,041) (4,545) 998,472 — 714,886
Equity in earnings of subsidiaries ................ 1,468,113 44,626 — (1,512,739) —
Net earnings ............................... $ 1,055,948 $ 37,912 $ 1,474,827 $ (1,512,739) $ 1,055,948
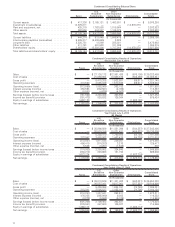
Sysco
Sysco
International
Other
Non-Guarantor
Subsidiaries
Consolidated
Totals
Condensed Consolidating Cash Flows
Year Ended July 2, 2011
(In thousands)
Net cash provided by (used for):
Operating activities........................................ $ (351,468) $ 54,049 $ 1,388,937 $ 1,091,518
Investing activities ........................................ (203,090) — (476,466) (679,556)
Financing activities ........................................ (555,282) — 177,375 (377,907)
Effect of exchange rate on cash ............................... — — 20,267 20,267
Intercompany activity ...................................... 1,041,830 (54,049) (987,781) —
Net (decrease) increase in cash ............................... (68,010) — 122,332 54,322
Cash at the beginning of the period ............................ 373,523 — 211,920 585,443
Cash at the end of the period ................................ $ 305,513 $ — $ 334,252 $ 639,765
72