Sysco 2011 Annual Report Download - page 84
Download and view the complete annual report
Please find page 84 of the 2011 Sysco annual report below. You can navigate through the pages in the report by either clicking on the pages listed below, or by using the keyword search tool below to find specific information within the annual report.-
 1
1 -
2
-
3
-
4
-
5
-
6
-
7
-
8
-
9
-
10
-
11
-
12
-
13
-
14
-
15
-
16
-
17
-
18
-
19
-
20
-
21
-
22
-
23
-
24
-
25
-
26
-
27
-
28
-
29
-
30
-
31
-
32
-
33
-
34
-
35
-
36
-
37
-
38
-
39
-
40
-
41
-
42
-
43
-
44
-
45
-
46
-
47
-
48
-
49
-
50
-
51
-
52
-
53
-
54
-
55
-
56
-
57
-
58
-
59
-
60
-
61
-
62
-
63
-
64
-
65
-
66
-
67
-
68
-
69
-
70
-
71
-
72
-
73
-
 74
74 -
 75
75 -
 76
76 -
 77
77 -
 78
78 -
 79
79 -
 80
80 -
 81
81 -
 82
82 -
 83
83 -
 84
84 -
 85
85 -
 86
86 -
 87
87 -
 88
88 -
 89
89 -
 90
90 -
 91
91 -
 92
92 -
 93
93 -
 94
94 -
95
-
96
-
97
-
98
-
99
-
100
-
101
-
102
-
103
-
104
-
105
 |
 |

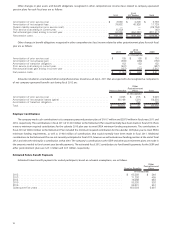
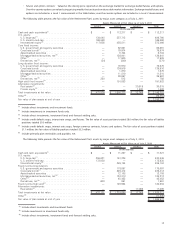
(4)
Include credit default swaps, interest rate swaps, foreign currency contracts, futures and options. The fair value of asset positions totaled
$13.5 million; the fair value of liability positions totaled $11.9 million.
(5)
Include primarily plan receivables and payables, net.
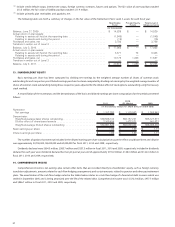
The following table sets forth a summary of changes in the fair value of the Retirement Plan’s Level 3 assets for each fiscal year:
Real Estate
Fund
Private Equity
Funds
Total Level 3
Measurements
(In thousands)
Balance, June 27, 2009 ........................................... $ 14,839 $ — $ 14,839
Actual return on plan assets:
Relating to assets still held at the reporting date ........................ (1,545) — (1,545)
Relating to assets sold during the period . . ............................ (15) — (15)
Purchases and sales, net . . . ....................................... 3,786 — 3,786
Transfers in and/or out of Level 3 .................................... — — —
Balance, July 3, 2010 ............................................. $ 17,065 $ — $ 17,065
Actual return on plan assets:
Relating to assets still held at the reporting date ........................ 3,371 72 3,443
Relating to assets sold during the period . . ............................ — — —
Purchases and sales, net . . . ....................................... 10,179 1,408 11,587
Transfers in and/or out of Level 3 .................................... — — —
Balance, July 2, 2011 ............................................. $ 30,615 $ 1,480 $ 32,095
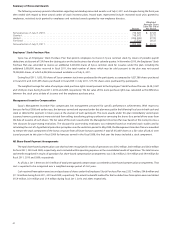
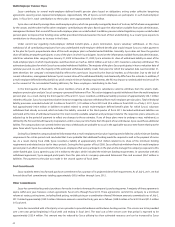
13. SHAREHOLDERS’ EQUITY
Basic earnings per share has been computed by dividing net earnings by the weighted average number of shares of common stock
outstanding for each respective year. Diluted earnings per share has been computed by dividing net earnings by the weighted average number of
shares of common stock outstanding during those respective years adjusted for the dilutive effect of stock options outstanding using the treasury
stock method.
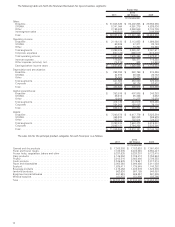
A reconciliation of the numerators and the denominators of the basic and diluted earnings per share computations for the periods presented
follows:
2011
2010
(53 Weeks) 2009
(In thousands, except for share and per share data)
Numerator:
Net earnings .......................................... $ 1,152,030 $ 1,179,983 $ 1,055,948
Denominator:
Weighted-average basic shares outstanding..................... 586,526,142 592,157,221 595,127,577
Dilutive effect of share-based awards ......................... 2,165,404 1,432,821 941,627
Weighted-average diluted shares outstanding ................... 588,691,546 593,590,042 596,069,204
Basic earnings per share: ................................... $ 1.96 $ 1.99 $ 1.77
Diluted earnings per share: .................................. $ 1.96 $ 1.99 $ 1.77
The number of options that were not included in the diluted earnings per share calculation because the effect would have been anti-dilutive
was approximately 50,700,000, 58,200,000 and 63,000,000 for fiscal 2011, 2010 and 2009, respectively.
Dividends declared were $604.5 million, $585.7 million and $557.5 million in fiscal 2011, 2010 and 2009, respectively. Included in dividends
declared for each year were dividends declared but not yet paid at year-end of approximately $155.0 million, $148.0 million and $142.0 million in
fiscal 2011, 2010 and 2009, respectively.
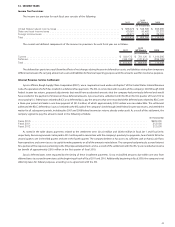
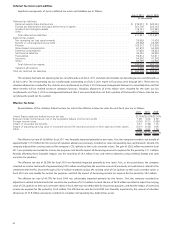
14. COMPREHENSIVE INCOME
Comprehensive income is net earnings plus certain other items that are recorded directly to shareholders’ equity, such as foreign currency
translation adjustments, amounts related to cash flow hedging arrangements and certain amounts related to pension and other postretirement
plans. The amortization of the cash flow hedge noted in the tables below relates to a cash flow hedge of a forecasted debt issuance which was
settled in September 2005 and is being amortized over the life of the related debt. Comprehensive income was $1,372.3 million, $977.7 million
and $846.7 million in fiscal 2011, 2010 and 2009, respectively.
60