Sysco 2011 Annual Report Download - page 47
Download and view the complete annual report
Please find page 47 of the 2011 Sysco annual report below. You can navigate through the pages in the report by either clicking on the pages listed below, or by using the keyword search tool below to find specific information within the annual report.-
 1
1 -
2
-
3
-
4
-
5
-
6
-
7
-
8
-
9
-
10
-
11
-
12
-
13
-
14
-
15
-
16
-
17
-
18
-
19
-
20
-
21
-
22
-
23
-
24
-
25
-
26
-
27
-
28
-
29
-
30
-
31
-
32
-
33
-
34
-
35
-
36
-
 37
37 -
 38
38 -
 39
39 -
 40
40 -
 41
41 -
 42
42 -
 43
43 -
 44
44 -
 45
45 -
 46
46 -
 47
47 -
 48
48 -
 49
49 -
 50
50 -
 51
51 -
 52
52 -
 53
53 -
 54
54 -
 55
55 -
 56
56 -
 57
57 -
58
-
59
-
60
-
61
-
62
-
63
-
64
-
65
-
66
-
67
-
68
-
69
-
70
-
71
-
72
-
73
-
74
-
75
-
76
-
77
-
78
-
79
-
80
-
81
-
82
-
83
-
84
-
85
-
86
-
87
-
88
-
89
-
90
-
91
-
92
-
93
-
94
-
95
-
96
-
97
-
98
-
99
-
100
-
101
-
102
-
103
-
104
-
105
 |
 |

Sales
Sales were 9.2% greater in fiscal 2011 than in fiscal 2010. Negatively affecting the sales comparison of fiscal 2011 to fiscal 2010 was the
additional week in fiscal 2010. The increase in sales was primarily due to case volume improvement largely attributable to new customers and, to a
lesser extent, from an increase in volume from certain existing customers.
Sales were 1.1% greater in fiscal 2010 than in fiscal 2009. The additional week contributed to the sales growth in fiscal 2010. Case volume
improvement caused an increase in sales in fiscal 2010 as compared to fiscal 2009. This case growth was largely attributable to new customers
added largely in the latter part of the fiscal year and the additional week in fiscal 2010. Partially offsetting these case volume improvements was a
decline in volume from existing customers due to the weak economic environment which applied continued pressure to consumer discretionary
spending and negatively impacted overall restaurant traffic counts. Product cost deflation, which led to decreases in selling prices also impacted
fiscal 2010 sales growth.
One chain restaurant customer (The Wendy’s Company) accounted for approximately 31% of the SYGMA segment sales for the fiscal year
ended July 2, 2011. SYGMA maintains multiple regional contracts with varied expiration dates with this customer. While the loss of this customer
would have a material adverse effect on SYGMA, we do not believe that the loss of this customer would have a material adverse effect on Sysco as
a whole.
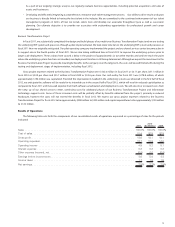
Operating Income
Operating income increased $12.9 million in 2011 over the prior year due to increased sales and improved productivity. Gross profit dollars
increased 9.5% while operating expenses increased 7.3% in fiscal 2011 from fiscal 2010. Contributing to the gross profit increase in fiscal 2011 were
increased sales and an increase of approximately $6.6 million in the fuel surcharges charged to customers in fiscal 2011 from prior year due to
higher fuel prices in fiscal 2011. The increase in operating expenses for fiscal 2011 was largely driven by increased delivery and warehouse
personnel payroll costs resulting from increased sales as well as increased fuel cost. Productivity improvements occurred within our warehouse
and delivery functions in fiscal 2011 and expense reductions occurred within our administrative functions in fiscal 2011 as compared to the prior
year. Fuel costs in fiscal 2011 were $12.9 million greater than the prior year. Assuming that fuel prices do not significantly rise above recent levels
during fiscal 2012, we expect fuel costs and fuel surcharges for our SYGMA segment to increase as compared to fiscal 2011.
Operating income increased by $17.1 million in fiscal 2010 as compared to fiscal 2009. Gross profit dollars increased 0.7% while operating
expenses decreased 3.7% in fiscal 2010 as compared to fiscal 2009. The additional week in fiscal 2010 contributed to the gross profit increase,
partially offset by a decrease of approximately $11.4 million in the fuel surcharges charged to customers in fiscal 2010 compared to fiscal 2009 due
to lower fuel prices in fiscal 2010. Expense reductions were accomplished by operational efficiencies in both delivery and warehouse areas, as well
as lower payroll expense related to headcount reductions. Also contributing to the decrease in operating expenses was a decrease of $10.1 million
in fuel costs in fiscal 2010 from the prior year due to lower fuel prices.
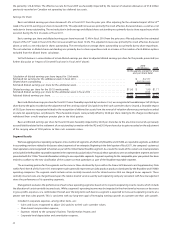
Other Segment
“Other” financial information is attributable to our other operating segments, including our specialty produce and lodging industry products
and a company that distributes to international customers. These operating segments are discussed on an aggregate basis as they do not
represent reportable segments under segment accounting literature.
On an aggregate basis, our “Other” segment has had a lower operating income as a percentage of sales than Sysco’s Broadline segment.
Sysco has acquired the operating companies within these segments in relatively recent years. These operations generally operate in a niche within
the foodservice industry. Each individual operation is also generally smaller in sales and scope than an average Broadline operation and each of
these operating segments is considerably smaller in sales and overall scope than the Broadline segment. In fiscal 2011, in the aggregate, the
“Other” segment represented approximately 5.6% of Sysco’s overall sales and 4.1% of the aggregate operating income of Sysco’s segments, which
excludes corporate expenses and consolidated adjustments.
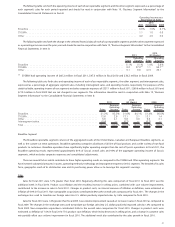
Operating income increased 9.6% for fiscal 2011 from fiscal 2010. The operating income comparison was negatively affected by the
additional week in fiscal 2010. The increase in operating income was caused primarily by increased sales in the specialty produce segment and
favorable expense management in the specialty produce and lodging industry products segments.
Operating income increased 29.7% for fiscal 2010 from fiscal 2009. The increase in operating income was caused primarily by increased sales
in our specialty produce segment and increased operating income in all segments due to favorable expense management. The additional week in
fiscal 2010 also contributed to the increase in operating income.
Liquidity and Capital Resources
Sysco’s strategic objectives require continuing investment and our financial resources include cash provided by operations and access to
capital from financial markets. Our operations historically have produced significant cash flow. Cash generated from operations is generally
allocated to working capital requirements; investments in facilities, systems, fleet, other equipment and technology; acquisitions compatible with
our overall growth strategy; and cash dividends. Any remaining cash generated from operations may be invested in high-quality, short-term
instruments or applied toward the cost of the share repurchase program. As a part of our ongoing strategic analysis, we regularly evaluate
23