Sysco 2011 Annual Report Download - page 67
Download and view the complete annual report
Please find page 67 of the 2011 Sysco annual report below. You can navigate through the pages in the report by either clicking on the pages listed below, or by using the keyword search tool below to find specific information within the annual report.-
 1
1 -
2
-
3
-
4
-
5
-
6
-
7
-
8
-
9
-
10
-
11
-
12
-
13
-
14
-
15
-
16
-
17
-
18
-
19
-
20
-
21
-
22
-
23
-
24
-
25
-
26
-
27
-
28
-
29
-
30
-
31
-
32
-
33
-
34
-
35
-
36
-
37
-
38
-
39
-
40
-
41
-
42
-
43
-
44
-
45
-
46
-
47
-
48
-
49
-
50
-
51
-
52
-
53
-
54
-
55
-
56
-
 57
57 -
 58
58 -
 59
59 -
 60
60 -
 61
61 -
 62
62 -
 63
63 -
 64
64 -
 65
65 -
 66
66 -
 67
67 -
 68
68 -
 69
69 -
 70
70 -
 71
71 -
 72
72 -
 73
73 -
 74
74 -
 75
75 -
 76
76 -
 77
77 -
78
-
79
-
80
-
81
-
82
-
83
-
84
-
85
-
86
-
87
-
88
-
89
-
90
-
91
-
92
-
93
-
94
-
95
-
96
-
97
-
98
-
99
-
100
-
101
-
102
-
103
-
104
-
105
 |
 |

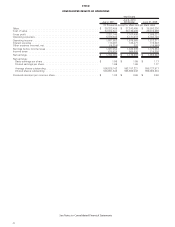
SYSCO
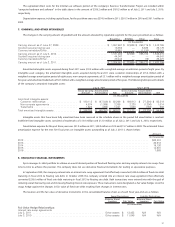
CHANGES IN CONSOLIDATED SHAREHOLDERS’ EQUITY
Shares Amount
Paid-in
Capital
Retained
Earnings
Accumulated
Other
Comprehensive
Loss Shares Amounts Totals
Common Stock Treasury Stock
(In thousands except for share data)
Balance as of June 28, 2008 . . . . 765,174,900 $765,175 $712,208 $6,041,429 $ (68,768) 163,942,358 $4,041,058 $3,408,986
Net earnings . . . . . . . . . . . . . . . 1,055,948 1,055,948
Foreign currency translation
adjustment . . . . . . . . . . . . . . . (84,452) (84,452)
Amortization of cash flow hedge,
netoftax................ 428 428
Reclassification of pension and
other postretirement benefit
plans amounts to net earnings,
net of tax . . . . . . . . . . . . . . . . 13,335 13,335
Pension liability assumption, net
of tax. . . . . . . . . . . . . . . . . . . (16,450) (16,450)
Pension funded status
adjustment, net of tax . . . . . . . (122,079) (122,079)
Comprehensive income . . . . . . . . 846,730
Dividends declared . . . . . . . . . . . (557,487) (557,487)
Treasury stock purchases. . . . . . . 16,951,200 438,842 (438,842)
Share-based compensation
awards . . . . . . . . . . . . . . . . . 48,144 (5,745,155) (142,171) 190,315
Balance as of June 27, 2009 . . . . 765,174,900 $765,175 $760,352 $6,539,890 $(277,986) 175,148,403 $4,337,729 $3,449,702
Net earnings . . . . . . . . . . . . . . . 1,179,983 1,179,983
Foreign currency translation
adjustment . . . . . . . . . . . . . . . 49,973 49,973
Amortization of cash flow hedge,
netoftax................ 428 428
Reclassification of pension and
other postretirement benefit
plans amounts to net earnings,
net of tax . . . . . . . . . . . . . . . . 27,464 27,464
Pension funded status
adjustment, net of tax . . . . . . . (280,130) (280,130)
Comprehensive income . . . . . . . . 977,718
Dividends declared . . . . . . . . . . . (585,734) (585,734)
Treasury stock purchases. . . . . . . 6,000,000 179,174 (179,174)
Share-based compensation
awards . . . . . . . . . . . . . . . . . 56,481 (4,379,608) (108,533) 165,014
Balance as of July 3, 2010 . . . . . . 765,174,900 $765,175 $816,833 $7,134,139 $(480,251) 176,768,795 $4,408,370 $3,827,526
Net earnings . . . . . . . . . . . . . . . 1,152,030 1,152,030
Foreign currency translation
adjustment . . . . . . . . . . . . . . . 122,217 122,217
Amortization of cash flow hedge,
netoftax................ 428 428
Reclassification of pension and
other postretirement benefit
plans amounts to net earnings,
net of tax . . . . . . . . . . . . . . . . 51,659 51,659
Pension funded status
adjustment, net of tax . . . . . . . 45,989 45,989
Comprehensive income . . . . . . . . 1,372,323
Dividends declared . . . . . . . . . . . (604,500) (604,500)
Treasury stock purchases. . . . . . . 10,000,000 291,600 (291,600)
Treasury stock issued for
acquisitions . . . . . . . . . . . . . . (10,625) (422,132) (10,625) —
Share-based compensation
awards . . . . . . . . . . . . . . . . . 81,546 (12,749,317) (319,947) 401,493
Balance as of July 2, 2011 . . . . . . 765,174,900 $765,175 $887,754 $7,681,669 $(259,958) 173,597,346 $4,369,398 $4,705,242
See Notes to Consolidated Financial Statements
43