Sysco 2011 Annual Report Download - page 87
Download and view the complete annual report
Please find page 87 of the 2011 Sysco annual report below. You can navigate through the pages in the report by either clicking on the pages listed below, or by using the keyword search tool below to find specific information within the annual report.-
 1
1 -
2
-
3
-
4
-
5
-
6
-
7
-
8
-
9
-
10
-
11
-
12
-
13
-
14
-
15
-
16
-
17
-
18
-
19
-
20
-
21
-
22
-
23
-
24
-
25
-
26
-
27
-
28
-
29
-
30
-
31
-
32
-
33
-
34
-
35
-
36
-
37
-
38
-
39
-
40
-
41
-
42
-
43
-
44
-
45
-
46
-
47
-
48
-
49
-
50
-
51
-
52
-
53
-
54
-
55
-
56
-
57
-
58
-
59
-
60
-
61
-
62
-
63
-
64
-
65
-
66
-
67
-
68
-
69
-
70
-
71
-
72
-
73
-
74
-
75
-
76
-
 77
77 -
 78
78 -
 79
79 -
 80
80 -
 81
81 -
 82
82 -
 83
83 -
 84
84 -
 85
85 -
 86
86 -
 87
87 -
 88
88 -
 89
89 -
 90
90 -
 91
91 -
 92
92 -
 93
93 -
 94
94 -
 95
95 -
 96
96 -
 97
97 -
98
-
99
-
100
-
101
-
102
-
103
-
104
-
105
 |
 |

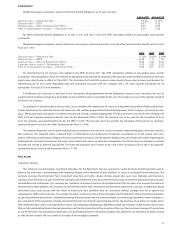
for the year preceding the option grant. The risk-free rate for the expected term of the option is based on the U.S. Treasury yield curve in effect at
the time of grant.
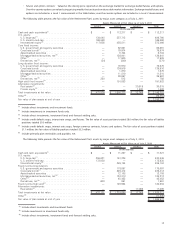
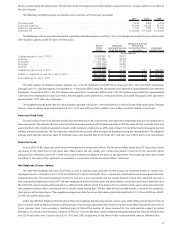
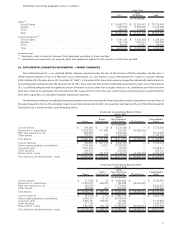
The following weighted-average assumptions were used for each fiscal year presented:
2011 2010 2009
Dividend yield ............................................................. 3.5% 3.6% 3.2%
Expected volatility . ......................................................... 23.4% 25.4% 34.7%
Risk-free interest rate ....................................................... 1.2% 2.3% 2.3%
Expected life ............................................................. 5.0years 4.9 years 4.5 years
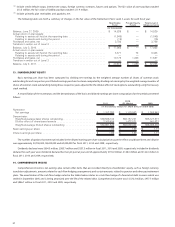
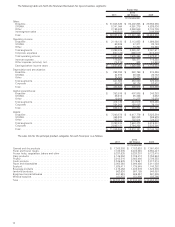
The following summary presents information regarding outstanding options as of July 2, 2011 and changes during the fiscal year then ended
with regard to options under all stock incentive plans:
Shares
Under
Option
Weighted
Average Exercise
Price Per Share
Weighted Average
Remaining
Contractual Term
(in years)
Aggregate
Intrinsic Value
(In thousands)
Outstanding as of July 3, 2010 ......................... 72,835,397 $ 29.72
Granted . . . ...................................... 7,190,250 28.86
Exercised . . ...................................... (11,461,735) 27.20
Forfeited . . ...................................... (422,309) 28.24
Expired.......................................... (749,295) 31.23
Outstanding as of July 2, 2011 ......................... 67,392,308 $ 30.05 2.77 $ 120,024
Vested or expected to vest as of July 2, 2011 ............... 66,718,623 $ 30.07 2.75 $ 117,725
Exercisable as of July 2, 2011 .......................... 45,522,993 $ 30.90 1.67 $ 46,562
The total number of employee options granted was 7,190,250, 8,494,200 and 8,089,750 in fiscal years 2011, 2010 and 2009, respectively.
During fiscal 2011, 1,423,000 options were granted to 11 executive officers and 5,767,250 options were granted to approximately 1,500 other key
employees. During fiscal 2010, 1,451,500 options were granted to 12 executive officers and 7,042,700 options were granted to approximately
1,600 other key employees. During fiscal 2009, 1,395,000 options were granted to 12 executive officers and 6,694,750 options were granted to
approximately 1,700 other key employees.
The weighted average grant-date fair value of options granted in fiscal 2011, 2010 and 2009 was $3.96, $4.53 and $5.88, respectively. The total
intrinsic value of options exercised during fiscal 2011, 2010 and 2009 was $45.5 million, $16.3 million and $24.4 million, respectively.
Restricted Stock Units
During fiscal 2011 and 2010, 656,000 and 652,300 restricted stock units, respectively, were granted to employees that will vest ratably over a
three-year period. The majority of these restricted stock units were granted with dividend equivalents. The fair value of each restricted stock unit
award granted with a dividend equivalent is based on the company’s stock price as of the date of grant. For restricted stock unit awards granted
without dividend equivalents, the fair value was reduced by the present value of expected dividends during the vesting period. The weighted
average grant-date fair value per share of restricted stock units granted during the fiscal 2011 and 2010 was $28.72 and $27.24, respectively.
Restricted Stock
In fiscal 2009, 75,822 shares of restricted stock were granted to an executive officer. The fair value of these shares was $23.74 per share, which
was based on the stock price on the grant date. These shares will vest ratably over a three-year period. In fiscal 2010, this executive officer
announced his retirement, and 37,911 of the shares were forfeited according to the terms of the agreement. The remaining shares have vested
according to the terms of the agreement as amended in connection with the executive officer’s retirement.
Non-Employee Director Awards
The 2009 Non-Employee Directors Stock Plan, as well as previous plans, provides for the issuance of restricted awards to current non-
employee directors. During fiscal 2011, 2010 and 2009, 60,973, 58,310 and 65,631 shares, respectively, of restricted awards were granted to non-
employee directors. The awards granted in fiscal 2011 vest over a one-year period, and the awards granted in fiscal 2010 and 2009 vest over a
three-year period. Beginning in fiscal 2011, the non-employee directors may elect to receive these awards in restricted stock shares that will vest at
the end of the award’s stated vesting period or as deferred units which convert into shares of Sysco common stock upon a date selected by the
non-employee director that is subsequent to the award’s stated vesting date. The fair value of the restricted awards is based on the company’s
stock price as of the date of grant. The weighted average grant-date fair value of the shares granted during fiscal 2011, 2010 and 2009 was $28.87,
$27.44 and $24.99, respectively.
Under the 2009 Non-Employee Directors Stock Plan, non-employee directors may elect to receive up to 100% of their annual directors’ fees in
Sysco common stock on either an annual or deferred basis. Previous plans allowed for the election to receive up to 50% of annual directors’ fees in
Sysco common stock. Sysco provides a matching grant of 50% of the number of shares received for the stock election subject to certain
limitations. As a result of such elections, a total of 27,979, 23,111 and 21,966 shares with a weighted-average grant date fair value of $29.26, $24.42
and $27.49 per share were issued in fiscal 2011, 2010 and 2009, respectively, in the form of fully vested common stock or deferred units.
63