Sysco 2011 Annual Report Download - page 43
Download and view the complete annual report
Please find page 43 of the 2011 Sysco annual report below. You can navigate through the pages in the report by either clicking on the pages listed below, or by using the keyword search tool below to find specific information within the annual report.-
 1
1 -
2
-
3
-
4
-
5
-
6
-
7
-
8
-
9
-
10
-
11
-
12
-
13
-
14
-
15
-
16
-
17
-
18
-
19
-
20
-
21
-
22
-
23
-
24
-
25
-
26
-
27
-
28
-
29
-
30
-
31
-
32
-
 33
33 -
 34
34 -
 35
35 -
 36
36 -
 37
37 -
 38
38 -
 39
39 -
 40
40 -
 41
41 -
 42
42 -
 43
43 -
 44
44 -
 45
45 -
 46
46 -
 47
47 -
 48
48 -
 49
49 -
 50
50 -
 51
51 -
 52
52 -
 53
53 -
54
-
55
-
56
-
57
-
58
-
59
-
60
-
61
-
62
-
63
-
64
-
65
-
66
-
67
-
68
-
69
-
70
-
71
-
72
-
73
-
74
-
75
-
76
-
77
-
78
-
79
-
80
-
81
-
82
-
83
-
84
-
85
-
86
-
87
-
88
-
89
-
90
-
91
-
92
-
93
-
94
-
95
-
96
-
97
-
98
-
99
-
100
-
101
-
102
-
103
-
104
-
105
 |
 |

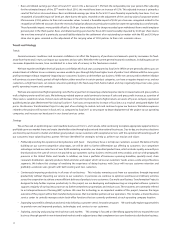
Gross project expenses related to our Business Transformation Project, inclusive of pay-related expense, increased by $20.8 million in fiscal
2011 from fiscal 2010 and by $41.6 million in fiscal 2010 from fiscal 2009. The increase in fiscal 2011 resulted from increased project spend
including the initial stages of ramping up of our shared services center and a provision for severance resulting from the implementation of an
involuntary severance plan. The increase in fiscal 2010 resulted from only six months of activity being included in fiscal 2009, as the Business
Transformation Project began in January 2009. Provided the improvements needed in the underlying systems are obtained in the first half of fiscal
2012, we anticipate the software will be ready for its intended use in the second half of fiscal 2012, which will result in increased expense from both
software amortization and deployment costs. We will also incur increased costs from the ramp up of our shared services center, continuing costs
for additional phases of our Business Transformation Project and information technology support costs. We believe the increase in gross project
expenses, including all pay-related expenses, related to the Business Transformation Project in fiscal 2012 as compared to fiscal 2011 will be
approximately $175 million to $195 million.
We adjust the carrying values of our COLI policies to their cash surrender values on an ongoing basis. The cash surrender values of these
policies are largely based on the values of underlying investments, which through fiscal 2011 included publicly traded securities. As a result, the
cash surrender values of these policies fluctuated with changes in the market value of such securities. The changes in the financial markets
resulted in gains for these policies of $28.2 million in fiscal 2011, compared to gains for these policies of $21.6 million in fiscal 2010 and losses of
$43.8 million in fiscal 2009. Near the end of fiscal 2011, we reallocated all of our policies into low-risk, fixed-income securities and therefore we no
longer expect significant volatility in operating income, net earnings and earnings per share in future periods related to these policies.
The provision for losses on receivables included within operating expenses decreased by $39.7 million in fiscal 2010 over fiscal 2009. The
decrease in our provision for losses on receivables in fiscal 2010 reflects fewer customer accounts exceeding our threshold for write-off in fiscal
2010 as compared to fiscal 2009. Customer accounts written off, net of recoveries, were $37.8 million, or 0.10% of sales, $34.3 million, or 0.10% of
sales, and $71.9 million, or 0.20% of sales, for fiscal 2011, 2010 and 2009, respectively. Our provision for losses on receivables will fluctuate with
general market conditions, as well as the circumstances of our customers.
Net Earnings
Net earnings for fiscal 2011 decreased 2.4% over the comparable prior year period. After adjusting for the estimated impact of the 53
rd
week
in fiscal 2010, the decrease would have been 0.3%. This adjusted decrease was primarily due to the factors discussed above and an increase in the
effective tax rate. The effective tax rate for fiscal 2011 was 36.96%, compared to an effective tax rate of 36.20% for fiscal 2010. The difference
between the tax rates for the two periods resulted largely from the one-time reversal of interest accruals for tax contingencies related to our
settlement with the Internal Revenue Service (IRS) in the first quarter of fiscal 2010.
Net earnings increased 11.7% in fiscal 2010 from fiscal 2009. After adjusting for the estimated impact of the 53
rd
week in fiscal 2010, the
increase would have been 9.5%. This adjusted increase was primarily due to a reduction in the effective income tax rate, as well as the factors
discussed above. The effective tax rate for fiscal 2010 was 36.20%, compared to an effective tax rate of 40.37% for fiscal 2009. The difference
between the tax rates for the two periods resulted largely from the one-time reversal of interest accruals for tax contingencies related to our
settlement with the Internal Revenue Service (IRS) in the first quarter of fiscal 2010.
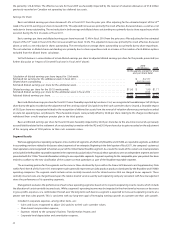
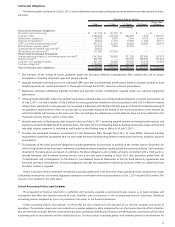
Set forth below is a reconciliation of actual net earnings to adjusted net earnings for the periods presented (see further discussion at “Impact
of 53-week fiscal year in Fiscal 2010” above):
2011
2010
(53 Weeks) 2009
(In thousands)
Net earnings for the 53/52 week periods . . . ......................................... $1,152,030 $1,179,983 $1,055,948
Estimated net earnings for the additional week in fiscal 2010 . ............................ — 24,127 —
Adjusted net earnings .......................................................... $1,152,030 $1,155,856 $1,055,948
Actual percentage (decrease) increase .............................................. (2.4)% 11.7%
Adjusted percentage (decrease) increase . . . ......................................... (0.3)% 9.5%
The effective tax rate of 36.96% for fiscal 2011 was favorably impacted primarily by two items. First, we recorded a tax benefit of
approximately $17.0 million for the reversal of valuation allowances previously recorded on state net operating loss carryforwards. Second, we
adjust the carrying values of our COLI policies to their cash surrender values. The gain of $28.2 million recorded in fiscal 2011 was primarily non-
taxable for income tax purposes, and had the impact of decreasing income tax expense for the period by $11.1 million. Partially offsetting these
favorable impacts was the recording of $9.3 million in tax and interest related to various federal, foreign and state uncertain tax positions.
The effective tax rate of 36.20% for fiscal 2010 was favorably impacted primarily by two items. First, we recorded an income tax benefit of
approximately $29.0 million resulting from the one-time reversal of a previously accrued liability related to the settlement with the IRS (See
“Liquidity and Capital Resources, Other Considerations, BSCC Cooperative Structure” for additional discussion). Second, the gain of $21.6 million
recorded to adjust the carrying value of COLI policies to their cash surrender values in fiscal 2010 was non-taxable for income tax purposes, and
had the impact of decreasing income tax expense for the period by $8.3 million.
The effective tax rate of 40.37% for fiscal 2009 was unfavorably impacted primarily by two factors. First, we recorded tax adjustments related
to federal and state uncertain tax positions of $31.0 million. Second, the loss of $43.8 million recorded to adjust the carrying value of COLI policies
to their cash surrender values in fiscal 2009 was non-deductible for income tax purposes, and had the impact of increasing income tax expense for
19