Sysco 2011 Annual Report Download - page 97
Download and view the complete annual report
Please find page 97 of the 2011 Sysco annual report below. You can navigate through the pages in the report by either clicking on the pages listed below, or by using the keyword search tool below to find specific information within the annual report.-
 1
1 -
2
-
3
-
4
-
5
-
6
-
7
-
8
-
9
-
10
-
11
-
12
-
13
-
14
-
15
-
16
-
17
-
18
-
19
-
20
-
21
-
22
-
23
-
24
-
25
-
26
-
27
-
28
-
29
-
30
-
31
-
32
-
33
-
34
-
35
-
36
-
37
-
38
-
39
-
40
-
41
-
42
-
43
-
44
-
45
-
46
-
47
-
48
-
49
-
50
-
51
-
52
-
53
-
54
-
55
-
56
-
57
-
58
-
59
-
60
-
61
-
62
-
63
-
64
-
65
-
66
-
67
-
68
-
69
-
70
-
71
-
72
-
73
-
74
-
75
-
76
-
77
-
78
-
79
-
80
-
81
-
82
-
83
-
84
-
85
-
86
-
 87
87 -
 88
88 -
 89
89 -
 90
90 -
 91
91 -
 92
92 -
 93
93 -
 94
94 -
 95
95 -
 96
96 -
 97
97 -
 98
98 -
 99
99 -
 100
100 -
 101
101 -
 102
102 -
 103
103 -
 104
104 -
 105
105
 |
 |

Sysco
Sysco
International
Other
Non-Guarantor
Subsidiaries
Consolidated
Totals
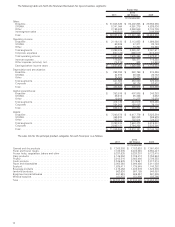
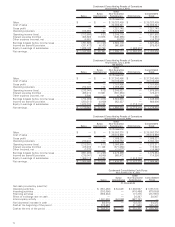
Condensed Consolidating Cash Flows
Year Ended July 3, 2010
(53 Weeks)
(In thousands)
Net cash provided by (used for):
Operating activities........................................ $ (503,318) $ 31,739 $ 1,357,007 $ 885,428
Investing activities ........................................ (225,565) — (430,755) (656,320)
Financing activities ........................................ (664,236) — (2,794) (667,030)
Effect of exchange rate on cash. . ............................. — — 4,714 4,714
Intercompany activity ...................................... 867,446 (31,739) (835,707) —
Net (decrease) increase in cash . . ............................. (525,673) — 92,465 (433,208)
Cash at the beginning of the period ............................ 899,196 — 119,455 1,018,651
Cash at the end of the period . . . ............................. $ 373,523 $ — $ 211,920 $ 585,443
Sysco
Sysco
International
Other
Non-Guarantor
Subsidiaries
Consolidated
Totals
Condensed Consolidating Cash Flows
Year Ended June 27, 2009
(In thousands)
Net cash provided by (used for):
Operating activities ....................................... $ (354,022) $ 38,340 $ 1,892,431 $ 1,576,749
Investing activities ....................................... (82,684) — (575,979) (658,663)
Financing activities ....................................... (380,564) — 921 (379,643)
Effect of exchange rate on cash . . ............................ — — 334 334
Intercompany activity ..................................... 1,229,820 (38,340) (1,191,480) —
Net increase in cash ...................................... 412,550 — 126,227 538,777
Cash at the beginning of the period ........................... 486,646 — (6,772) 479,874
Cash at the end of the period ................................ $ 899,196 $ — $ 119,455 $ 1,018,651
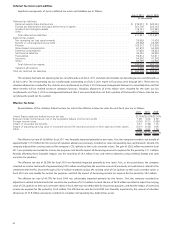
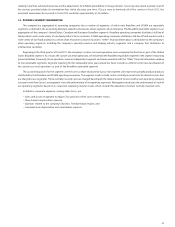
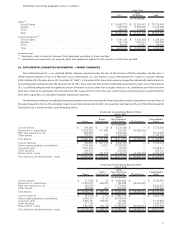
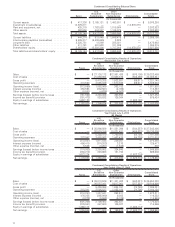
21. SUPPLEMENTAL GUARANTOR INFORMATION — SUBSIDIARY GUARANTEES
On January 19, 2011, the wholly-owned U.S. Broadline subsidiaries of Sysco Corporation entered into full and unconditional guarantees of all
outstanding senior notes and debentures of Sysco Corporation. As of July 2, 2011, Sysco had a total of approximately $2,225.0 million in senior
notes and debentures outstanding that are covered by this guarantee.
The following condensed consolidating financial statements present separately the financial position, results of operations and cash flows of
the parent issuer (Sysco Corporation), the guarantors (U.S. Broadline subsidiaries) and all other non-guarantor subsidiaries of Sysco (Other Non-
Guarantor Subsidiaries) on a combined basis with eliminating entries.
Sysco
U.S.
Broadline
Subsidiaries
Other
Non-Guarantor
Subsidiaries Eliminations
Consolidated
Totals
Condensed Consolidating Balance Sheet
July 2, 2011
(In thousands)
Current assets . ......................... $ 354,450 $ 3,476,921 $ 1,901,511 $ — $ 5,732,882
Investment in subsidiaries.................. 13,588,905 — — (13,588,905) —
Plant and equipment, net .................. 569,567 1,794,473 1,148,349 — 3,512,389
Other assets . . ......................... 378,317 519,664 1,242,303 — 2,140,284
Total assets. . . ......................... $ 14,891,239 $ 5,791,058 $ 4,292,163 $ (13,588,905) $ 11,385,555
Current liabilities ........................ $ 430,300 $ 840,586 $ 2,304,189 $ — $ 3,575,075
Intercompany payables (receivables) .......... 7,374,590 (7,303,529) (71,061) — —
Long-term debt ......................... 2,227,483 26,542 25,492 — 2,279,517
Other liabilities ......................... 405,376 343,427 76,918 — 825,721
Shareholders’ equity...................... 4,453,490 11,884,032 1,956,625 (13,588,905) 4,705,242
Total liabilities and shareholders’ equity......... $ 14,891,239 $ 5,791,058 $ 4,292,163 $ (13,588,905) $ 11,385,555
73